DCPS Black Students need six years to reach where DCPS White students stood in 4th grade

February 15, 2016

“DC achievement gaps now, DC achievement gaps tomorrow, DC achievement gaps FOREVER!”

(Guest Post by Matthew Ladner)

Last week I told you that White DC 4th grade students were outscoring the average achievement of Black 8th graders on math by a wide margin. The below chart presents data from the 2011 4th grade math NAEP along with 8th grade scores from 2015. Data for White and Black students from the DCPS and Black students from DC charters are presented.

DC gap trend 1

I’ve looked at the both the main NAEP and the Trial Urban District Assessment and you simply cannot find another spot that matches DC for achievement gaps. As you can see, by 4th grade DC White students have already demonstrated  a level of mastery of mathematics that 8th grade Black students come nowhere close to matching by 8th grade. At fourth grade a sixty point gap between the achievement of White and Black students yawns (272 to 212). Meanwhile DCPS Black students have not come close to catching up to the 4th grade White score 4 years later. In fact at the rate of progress shown by DCPS Black students we would expect them to catch up to the 4th grade scores of DCPS White students somewhere around their sophomore or junior year of high-school.

No one should view the closing of these gaps as easy. Notice that DC Black students attending charter schools started 8 points ahead of their district counterparts in 2011 and then gained more between 2011 and 2015 (46 points for charter students, 36 for District). This left DC Black students within striking distance of the 4th grade score of DC White students (272 to 266) but still far behind DCPS 8th grade White students (314 to 266). Still DC’s Black charter school students made the largest overall gains (46 points) and did so for about half of the average revenue per pupil in DCPS.

Sick to your stomach yet? Can’t believe it? Well let’s check the tape for the NAEP reading exam.

DC gap trend 2


We see precisely the same pattern- by 4th grade DC White students demonstrate a level of mastery of reading that Black students will not equal by 8th grade. A huge gap between DCPS White and Black students (64 points) yawns out in the 2011 4th grade scores and does not meaningfully narrow by the time the cohort reaches 8th grade in 2015 (63 points). DC Black students attending charter schools demonstrated a smaller gap in 2011 (57 points) and had narrowed it a bit further by 2015 (51 points) but had still not caught up to the score of DCPS White students in 2011.

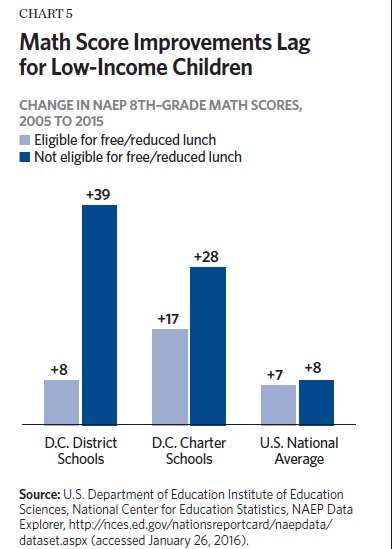
Before you reach for your demographic fatalism pistol let me just note that FRL eligible Black students attending district schools in Boston scored 24 points higher than FRL Black students attending district schools in DC. New York City and Houston clobbered DCPS by 16 points in the same comparison. None of these districts receive $29,000 per student in revenue. Houston didn’t sniff half of that figure. We cannot disentangle the effect of schooling and family with these data, but other systems seem to do much more for similar students with much less.

Getting back to the Heritage study– someone take a look at this data and tell me why oh why would we want to shower $29,000 per student on the system that produces such catastrophic results for disadvantaged kids. Charters receive only $14k per student that and get better results. Congress provides a constantly politically imperiled $8k per child on a small voucher program for low-income DC kids that merely gets them over the high-school graduation finish line at a 20% higher rate. This system of finance has been in place for decades now. Piling money on a system proficient only at serving the needs of the already advantaged while starving systems serving the disadvantaged for funds makes sense to someone.

It just doesn’t make sense to me. It shouldn’t make sense to you either.


DC: Achievement Gap Capital of the United States

February 12, 2016

(Guest Post by Matthew Ladner)

So when you have this go on for years (huge gains for the well to do, not so much for low-income kids):

Ladner DC 7

You wind up with this:

DC achievement gap

It is only with some reluctance that I raise this topic. In one of the editions of the Report Card on American Education we spent an entire chapter on achievement gaps and just how tricky they can be. West Virginia for instance, down at the bottom of the chart, had a low achievement gap a few years ago because both White and Black scores were declining, but White scores were falling faster than Black scores…but the achievement gap was closing….Huzzah?

Um, no.

In the end though the situation in DC is much more straightforward: White scores are really, really high while Black scores are really low. In the end there really isn’t much lipstick to put on an almost sixty point achievement gap pig. DC has the highest scores for White kids in the country by a 12 point margin but scores for Black students towards the bottom of the barrel.

In 2015 DC’s White 4th graders had a substantially higher score on the 4th grade math exam (274) than Black students attending DCPS had on the 8th grade exam (248). I’m no social justice warrior, but that should sicken anyone’s soul.

This is again a partially a reflection of the gentrification trend. The fact that more well to do families are staying in the District is very good for the financial health of the city. Most of DC’s school budget is locally generated and the rising affluence of the District has in fact generated an embarrassment of riches on the revenue per pupil statistics ($29k+ per year per kid).

Would that the District of Columbia Public Schools had made better use of it. The charter sector, with approximately half of the resources per pupil, Black students scored 18 points higher on the above exam. This cuts the achievement gap between Black students attending charter schools and White students in their enclaves of excellence in DCPS by approximately a third. Miles and miles to go to be sure, but at least the journey is underway.

Meanwhile back at DCPS…it can be very hard to focus.


Drowning in Dollars but Starving for Gains: DCPS Spending and Scores in Context

February 10, 2016


(Guest Post by Matthew Ladner)

In our next exciting episode of reviewing the DC education scene from the new study I wrote with Heritage we take a look at where the District remains despite a stunning level of investment and 25 years of improvement.

So let’s put DC into context in terms of revenue per pupil with data from the United States Census Bureau.

Ladner DC 1

DC charter schools seem to be bringing in somewhere in the neighborhood of half of that figure on a per pupil basis. Now let’s see what the Trial Urban District Assessment NAEP has to say about how DC kids compare. The chart below compares kids on NAEP 8th grade math scores for students whose parents graduated from high-school but did not attend college. The hope here is to rank districts by kids not born on third base.

Ladner DC 5

Note that if you do the same comparison by FRL status instead of parental education you still find DC ranked only ahead of Detroit and behind everyone else. The 17 point advantage for DC charter school kids in the above chart is considerable, but as the comparison makes painfully obvious, DC charters may be on their way, but they have not arrived. Still with less money and better scores the ROI is far, far higher than DCPS.

The heartbreaking part of the story however lies with the DCPS students. I’m not going to bother to look up the revenue per pupil statistics for Detroit but I am putting the over/under at half that of DC. Decades into DC reform efforts DCPS remains largely unchanged- far better at spending money than at teaching children, other than those who bought or worked their way into the high performing schools.

Next episode we’ll discuss what to do next. It shouldn’t involve continuing to bang our heads against the “better scores through improved management in an utterly broken system” wall. It also does not involve giving up.


Scenes from the Great Education Stagnation

October 2, 2015

(Guest Post by Matthew Ladner)

If a picture is worth a thousand words, here are 3,000 for you. First American manufacturing does more with fewer people (HT: AEI’s Mark J. Perry):

Okay good- ready for the next one? Heritage chart showing that the American education massively increases employment relative to the student count:


But it’s all fine because the kids are learning so much surrounded by so many adults compared to the past right? Er, no:


Baumol by Design

October 25, 2012

(Guest Post by Matthew Ladner)

Part four of the Baumol Disease series is up over at the EdFly Blog, including spectacular new Baumol charts from the Heritage Foundation and an excerpt from Terry Moe’s book Special Interest regarding the history of the Florida Education Association hijacking the Florida Democratic Party during the 2002 election.

Also be sure to check out the Friedman Foundation’s incredibly cool K-12 Baumol Map by State. How bad is the disease where you live?


Heritage Foundation on Education Savings Accounts

October 5, 2011

(Guest Post by Matthew Ladner)

The Heritage Foundation has published a new web memo on Education Savings Accounts as a vehicle for parental choice. At this point, Arizona has passed an ESA program for special needs students, a proposal is under consideration in Ohio, Florida lawmakers considered a provision last year, and Utah has a whopper of a proposal on the way.

I had the opportunity to speak to Utah legislator John Dougall about his forthcoming proposal.  Rep. Dougall plans to file a bill that would send all education funding into Education Savings Accounts controlled by parents and guardians, but does not intend to make private school tuition a permissable expense for funds in the account. Dougall in essence plans to have a discussion about customized learning rather than a public vs. private school debate.

Being a Longhorn, this of course brings to mind a scene from the master thespian of our era, the great Matthew McConaughey:

McConaughey: Hey man, you got some private school choice in that ESA proposal?

Passenger: No man, not in this proposal.

McConaughey: Well, it would be alot cooler if you did!

Seriously though, Dougall’s proposal is sufficiently mind-blowing that it doesn’t really bother me that he is choosing to leave private schools out of the mix. If ten years from now Utah is funding district and virtual schooling through an ESA system and the private choice options available were going through tax credit and voucher mechanisms, you won’t hear any complaints from me.


New Heritage Brief on the Racial Achievement Gap

September 18, 2010


(Guest Post by Matthew Ladner)

Back in 1997, Professor Lawrence Stedman wrote:

Twelfth-grade black students are performing at the level of middle school white students. These students are about to graduate, yet they lag four or more years behind in every area including math, science, writing, history, and geography. Latino seniors do somewhat better than 8th-grade white students in math and writing but, in other areas, are also four years behind white 12th graders…. Schools and society remains divided into two different worlds, one black, one white, separate and unequal.

Thirteen years later, sadly not much has changed with the national numbers, but some states have proven that far-reaching policy changes can reduce achievement gaps.

Lindsey Burke and I sing a new duet celebrating Florida’s reduction of the racial achievement gap  in a new Heritage brief.  Let’s just say the evidence from Florida is fairly compelling:

From the brief:

If trends since 1998 were to hold nationally, it would be about 33 years before we could expect Hispanics to close the gap with their white peers. In Florida, however, black students could catch up in half that time, and Hispanics could exceed the national average for white students as early as 2011.

This is just the sort of progress that the “Broader-Bolder” crowd would like us to believe is not possible without a vast expansion of the welfare state.

OOOOOOOOPS! Do you think we’re stupid Hans? It is accountability with teeth, real transparency and expanded parental choice that is making this happen. Cue the slo-mo fall scene-and please try not to make too big of a mess on the sidewalk.


Burke and Ladner Sing the real “Empire State of Mind” Duet on NRO

June 9, 2010

Now you’re in New York FLOR-I-DA!  Our minority children outscore your WHOLE STATE! There’s nothing we can’t do! 

(Guest Post by Matthew Ladner)

The Heritage Foundation’s Lindsey Burke and I hit National Review Online on Florida’s K-12 success in raising minority academic achievement.

In California, Meg Whitman won the Republican nomination for governor in overwhelming fashion on Tuesday. As you can see on her campaign site, Whitman wants to bring Florida reforms to California, which desperately needs them. California is a gigantic state that scores like an urban school district on NAEP. Without large improvements in California, it is unlikely that we will see the United States even begin to close the academic gap with European and Asian nations.


Heritage and WaPo Bring the Pain

April 20, 2009

(Guest Post by Matthew Ladner)

Lindsey Burke of the Heritage Foundation published the results of the latest survey of where members of Congress sent/send their own children to school. The survey finds:

 • 44 percent of Senators and 36 percent of Representatives had ever sent their children to private schools. Among the general public, only 11 percent of American students attend private school.

• While members of the 111th Congress practice school choice for their own families, they should also support school choice policies for all of America’s families. A failed amendment offered by Senator John Ensign (R–NV) on behalf of the popular and successful D.C. Opportunity Scholarship Program would have passed if Members of Congress who exercised school choice for theirown children had voted in favor of the amendment. The future of the D.C. voucher program is now uncertain.Approximately 20 percent of Members of the 111th Congress attended private high school themselves—nearly twice the rate of the American public.

The Washington Post editorialized on the study this morning:

The gap between what Congress practices and what it preaches was best illustrated by the Heritage Foundation’s analysis of a recent vote to preserve the program. The measure was defeated by the Senate 58 to 39; it would have passed if senators who exercised school choice for their own children had voted in favor. Alas, the survey doesn’t name names, save for singling out Sen. Richard J. Durbin (D-Ill.), architect of the language that threatens the program, for sending his children to private school and attending private school himself…

Mr. Duncan, in a recent interview, spoke eloquently of his family’s choice of Arlington as a place to live because of what he called the “determining factor” of schools. He told Science magazine: “My family has given up so much so that I could have the opportunity to serve; I didn’t want to try to save the country’s children and our educational system and jeopardize my own children’s education.” We don’t think it’s too much to expect our leaders to treat their constituents with the same fairness and regard they demand for their own families.

Next year, I’d love to see Heritage go in to even greater depth. Let’s see how many Congressmen sent their children to Anacostia High, etc. Let’s put the over/under at one.

I’ll take the under.


%d bloggers like this: