Much to her credit, Washington Teachers Union President Elizabeth Davis responds to DC achievement gaps before anyone in DCPS or in the broader DC Reform Community

February 19, 2016

(Guest Post by Matthew Ladner)

Washington Teacher’s Union President Elizabeth Davis left a response to the post here on Jayblog showing that DCPS black students would go well into their high school years before catching up to where White DCPS students stood in 4th grade. I disagree in large part (but agree partially) with her take, and will briefly explain why below. Let the record show however that the score as of now stands WTO 1, DCPS 0 on the acknowledgement scorecard. Anyone? Anyone? Kaya?


Perhaps the large community of DC K-12 reform oriented organizations would like to join the conversation that Heritage started as well. I know the allure of delving into the minutiae of federal statutes can be very powerful, but it’s okay to leave the tower now and again to examine what is going on around you. As in right around you with your own tax dollars.

But silly me I digress! Ms. Davis’ response:

The PARCC scores showed that 24% of students in grades 3-8 in public and public charter schools met or exceeded expectations in math and 25% of those same students met or exceeded expectations in English Language Arts. The bottom line is that a full 75% of our students failed to meet expectations.

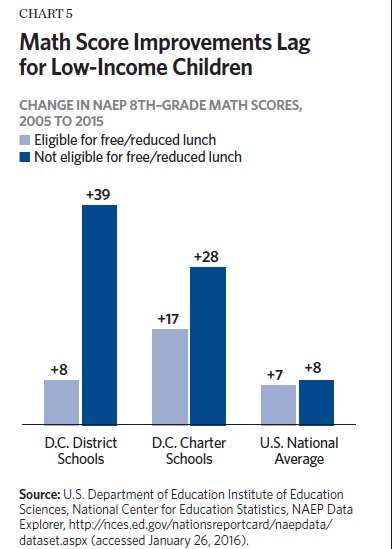
The Washington Teachers’ Union acknowledges that some aggregate gains have been made, and some of those gains have been significant. However, those significant gains are found in schools that have been least effected by the so-called reform strategies. In other words, where the school district has made the greatest gains is in the schools that were already high performing and not a target of the reforms. Conversely, students in schools where the most teachers were fired, that attended schools that were closed due to low test scores, and had the most teacher turnover saw meager gains compared to their wealthy counterparts.

For years the WTU has called on the District Administration to adequately address these unacceptable and rapidly growing achievement gaps. Those calls were met with hubris and more of the same top-down failed policies.

Today we ask the community to review these data and understand that doing more of the same will only make a bad situation worse. In the coming days we will share more data that helps explain this unfortunate situation and share the plan we proposed to the district many months ago.

We can close the achievement gap. But that will only happen when the current failed policies are discontinued and the voice of those working with the students in the classroom is a meaningful part of the improvement discussion.

Maybe most importantly, we must ensure that the school district’s teacher evaluation system does not penalize those teachers who take on the challenge of educating our neediest students. Over the past eight years, DCPS has replaced over 3,000 of its teachers. So the bad teacher narrative no longer applies as a credible reason for the growing achievement gap in our school district. Many of our members have told us that the IMPACT evaluation system victimizes those who teach in low-performing schools.

-Elizabeth Davis, President of the Washington Teachers’ Union

My brief take on the substance: yes the gentrified schools will have been least affected by the reforms but when they are posting NAEP scores that make Massachusetts blush policies aimed at removing ineffective educators won’t be very much in play.  Given the plight of disadvantaged children in DCPS it would seem difficult at best to argue that the staff hired to educate these children have too little job security. I am however willing to hear the case made.

Please note further that the DCPS charter sector has made progress in closing the achievement gap with significantly fewer resources per pupil than those granted to DCPS. I’ve seen but have not explored claims that these reforms are contributing to progress in DCPS, but I will say this much to agree with Ms. Davis- it is very difficult to find evidence of that claim in DC NAEP scores to date. While there is absolutely blindingly clear evidence that DC choice policies (charters and OSP) have clear benefits to disadvantaged DC children, you are hard pressed to make the case that anything else has done much for these kids to date in terms of generating positive trends.

I am entirely open to discussion and debate on that point, but when you have schools with scores barely above Detroit receiving over $29,000 per student in revenue, I find it difficult to reach any other conclusion. DC charters get less and show higher NAEP scores and gains. OSP shows higher graduation rates for profoundly disadvantaged kids with a fraction of the spending.

I’m at the point where it only makes sense to decentralize power further into the hands of the parents and let them sort things out. The details over equity (more money for low-income kids), academic transparency (light touch please) and financial accountability (brutal is better) would be crucial, but disadvantaged children in DCPS have nothing to lose and much to gain.

(edited for typos)


DC: Achievement Gap Capital of the United States

February 12, 2016

(Guest Post by Matthew Ladner)

So when you have this go on for years (huge gains for the well to do, not so much for low-income kids):

Ladner DC 7

You wind up with this:

DC achievement gap

It is only with some reluctance that I raise this topic. In one of the editions of the Report Card on American Education we spent an entire chapter on achievement gaps and just how tricky they can be. West Virginia for instance, down at the bottom of the chart, had a low achievement gap a few years ago because both White and Black scores were declining, but White scores were falling faster than Black scores…but the achievement gap was closing….Huzzah?

Um, no.

In the end though the situation in DC is much more straightforward: White scores are really, really high while Black scores are really low. In the end there really isn’t much lipstick to put on an almost sixty point achievement gap pig. DC has the highest scores for White kids in the country by a 12 point margin but scores for Black students towards the bottom of the barrel.

In 2015 DC’s White 4th graders had a substantially higher score on the 4th grade math exam (274) than Black students attending DCPS had on the 8th grade exam (248). I’m no social justice warrior, but that should sicken anyone’s soul.

This is again a partially a reflection of the gentrification trend. The fact that more well to do families are staying in the District is very good for the financial health of the city. Most of DC’s school budget is locally generated and the rising affluence of the District has in fact generated an embarrassment of riches on the revenue per pupil statistics ($29k+ per year per kid).

Would that the District of Columbia Public Schools had made better use of it. The charter sector, with approximately half of the resources per pupil, Black students scored 18 points higher on the above exam. This cuts the achievement gap between Black students attending charter schools and White students in their enclaves of excellence in DCPS by approximately a third. Miles and miles to go to be sure, but at least the journey is underway.

Meanwhile back at DCPS…it can be very hard to focus.


Drowning in Dollars but Starving for Gains: DCPS Spending and Scores in Context

February 10, 2016


(Guest Post by Matthew Ladner)

In our next exciting episode of reviewing the DC education scene from the new study I wrote with Heritage we take a look at where the District remains despite a stunning level of investment and 25 years of improvement.

So let’s put DC into context in terms of revenue per pupil with data from the United States Census Bureau.

Ladner DC 1

DC charter schools seem to be bringing in somewhere in the neighborhood of half of that figure on a per pupil basis. Now let’s see what the Trial Urban District Assessment NAEP has to say about how DC kids compare. The chart below compares kids on NAEP 8th grade math scores for students whose parents graduated from high-school but did not attend college. The hope here is to rank districts by kids not born on third base.

Ladner DC 5

Note that if you do the same comparison by FRL status instead of parental education you still find DC ranked only ahead of Detroit and behind everyone else. The 17 point advantage for DC charter school kids in the above chart is considerable, but as the comparison makes painfully obvious, DC charters may be on their way, but they have not arrived. Still with less money and better scores the ROI is far, far higher than DCPS.

The heartbreaking part of the story however lies with the DCPS students. I’m not going to bother to look up the revenue per pupil statistics for Detroit but I am putting the over/under at half that of DC. Decades into DC reform efforts DCPS remains largely unchanged- far better at spending money than at teaching children, other than those who bought or worked their way into the high performing schools.

Next episode we’ll discuss what to do next. It shouldn’t involve continuing to bang our heads against the “better scores through improved management in an utterly broken system” wall. It also does not involve giving up.


Gentrification is the primary driver of District of Columbia Academic Gains

February 9, 2016

The Capital is playing games with some limited success but low-income kids still hunger for academic gains.

(Guest Post by Matthew Ladner)

New study out today from the Heritage Foundation authored by yours truly on education in the District of Columbia. I will serialize the study a bit with a chart or two per post. The view I had of K-12 in the nation’s capital going into the project did not survive my investigation. My initial view going into the project is summarized in this chart:


Ladner DC 4

Moving your 8th grade math scores from 230 in 1990 to 263 (combined district and charter) in 2015 is a lot of progress- by far the largest gains in the nation. While things are somewhat worse if we look at District of Columbia Public Schools (DCPS) scores alone (258) they still are far above the earliest measure. Better yet- when you examine charter scores in isolation from DCPS scores, the scores are higher still. Any actual education going on in DCPS back in 1990 looks to have been mostly accidental- I’m not sure what you would score on the NAEP math test if you just answered “B” every time, but with 3% of DC students scoring proficient and 83% scored “Below Basic” on the NAEP 8th grade math exam in 1990, it could not have been much lower. In 2015 19% of DC students scored proficient and only 49% scored Below Basic. The improvement is undeniable: time to CeleNAEP? Those gains dwarf anything seen out in the states, and the charter school sector getting close to half of the students is clearly a major driver of improvement. Twirl for me, girl on fire!

Alas while this story is true it is far from complete. What is going on in DC is both complex, partially encouraging and in the end very disturbing.

Overall enrollment in DC (district and charter) had been growing in recent years along with average incomes. A complex phenomenon is underway in which sophisticated young parents have figured out that they don’t need to move to Maryland or Virginia if they can find a spot in the right district or charter school in the District. In the end your kid doesn’t get educated by a district or a CMO but rather by a school. DC is the champion for NAEP gains, but it is also the champion for achievement gaps.

You can see the gentrification going on both in DC’s statistics and with the naked eye walking around town. Somebody keeps buying those million plus dollar brown stones and some of them are parents. This begs the question: how much of DC’s apparent academic gains owes to gentrification?

Sadly the answer is- affluent children have banked the vast majority of DC NAEP gains over the last decade.

Ladner DC 7

There is a lot going on in this chart so pay close attention. These are again NAEP 8th grade math gains by family income (FRL status) over the last decade. First look at the light blue columns- gains for FRL eligible kids. DCPS district equals an 8 point gain, which is indistinguishable from the national average of 7 points. The 17 point gain for free and reduced lunch kids attending DC charter schools is the only real bright spot for disadvantaged kids in the public school system despite decades of reform. We used 8th grade math for purposes of illustration but you see a similar pattern across the NAEP exams.

Now observe the dark blue columns- DC kids whose incomes are too high for a Free or Reduced price lunch under federal guidelines. Here the gains are truly extraordinary- a 28 point gain for non-FRL kids attending charter schools and a 39 point gain for middle to high income district students. I’m placing my bet now that this isn’t solely due to schools in Georgetown doing an ever-better job educating kids with law-firm names, but also to the fact that people who once fled to Va and MD finding a spot that suited them in DC.

So in 1990 let’s estimate that the number of DCPS FRL kids scoring proficient on 8th grade math as effectively zero. Twenty five years later, that figure is up to 8 percent for district kids (charters excluded). DCPS in other words remains largely what it has always been- an organization far better at employing adults than meeting the needs of disadvantaged children. As we will see in a future post, the academic results of DCPS continue to disappoint even in comparisons against other urban districts despite 15 years of strong progress and gentrification.

I am Ozymandias-Queen of Queens! Look upon the ineffectiveness of my broom ye mighty and despair!

Overall the situation in DC K-12 is very complex- with both positive trends and heartbreaking stagnation. Regardless of where you are coming from on the political/philosophical side of things, if you are a DC taxpayer you should not stand for this state of affairs as it touches upon economically disadvantaged children. The above chart shows is that despite a truly shocking amount of tax effort and a decade and a half of reform, what DCPS has figured out how to do is to give the most academically to the kids born on third base. Mind you this is much better than giving approximately nothing to anyone a la DCPS circa 1990, but that is in the big picture a cold comfort. In the end it is very positive for the fiscal health of the District of Columbia that third base parents can in fact get a quality education for their children it in the right bits of DCPS. Moreover, those third base parents are paying a mind-numbing level of tax and they deserve a quality education for their children.

So does everyone else.


NAEP releases 2015 scores

October 28, 2015

2015 FRL NAEP 4R

(Guest Post by Matthew Ladner)

Let the fun begin! National aggregate results for all students are flat in 4R, down in the other four subjects. The declines are very small- one point on 4th grade math, two points on 8th grade math, down two points on 8th grade reading. On 500 point scale tests none the national results are not worth getting overly excited about- but why let that stop anyone!

The interesting stuff is also found by digging around.

It looks like Maryland must have finally put a stop their reign of terror against the NAEP inclusion standards for kids with disabilities and ELL because their scores declined substantially.

Good for them for making the move. DC looks to have overtaken a statewide average (New Mexico) after rocking the 4th grade reading NAEP with big gains again (see below). Louisiana, Mississippi and the Carolinas also demonstrated big gains on 4th grade reading.

I will take a close look at DC, but here is a preview looking only at general ed kids who are eligible for a free or reduced price lunch:

DC 4r 2015

26/21 point gains in 12 years among FRL eligible kids is very impressive. I’ll track the numbers by some alternative variables later since the definition of FRL has evolved over time. The last time I did this (by tracking kids by parental education instead of FRL status for instance) it confirmed that disadvantaged kids were making big gains in DC- so I will offer a somewhat premature congratulations.

More later…


DC District Schools are Improving Fast but not Fast Enough to Catch DC Charters

January 23, 2014

(Guest Post by Matthew Ladner)

When the National Center for Education Statistics first released the 2013 NAEP data, the website refused to cooperate with requests to give charter/district comparisons for the District of Columbia.  This is of especially strong interest given that 43% of DC public school children attend charter schools.

Well lo and behold the NAEP website decided to start cooperating, and the data tells a pretty amazing story: district schools are improving over time in DC, but charters show even stronger growth.

NAEP takes new random samples of students in each testing year, but judges performance consistently across time. Making comparisons between district and charter students isn’t easy.  The percentages of students in special programs for children with disabilities and English Language Learners can potentially impact average scores. So for instance if DC charter schools have fewer children with disabilities enrolled, or fewer ELL students, or fewer low-income children enrolled, they could appear to be doing a better job educating students when the truth could be quite different.

Fortunately NAEP allows us to take these factors into account.  The charts below show NAEP data that gets as close to an “apples to apples” comparison as possible, comparing only the scores of Free and Reduced lunch eligible students in the general education program. Two other sources of bias that could be expected to work against charter schools involve new schools and newly transferred students. Organizations tend to not be at their best during their “shakedown cruise” and schools are no exception.  Also students tend to take a temporary academic hit as they adjust to a new school after transferring.  Charter schools tend to have lots of new schools full of kids who just transferred in-providing a double whammy when looking at any snapshot of performance.

Unfortunately, NAEP does not contain any tools for taking the age or the school or length of enrollment into account. Thus DC charter schools are fighting at a bit of disadvantage, and a very substantial funding disadvantage, in the below charts.

DC charter 1

DC charters may be fighting with one hand tied behind their back, but it did not stop them from scoring a knockout on NAEP. DC charters widened their advantage in the percentage of children scoring “Basic or Better” from 4 points in 2011 to 9 points in 2013.

DC charter vs district 8r

DC district students saw a large improvement in 8th grade reading between the 2011 and 2013 NAEP, but still found themselves trailing the achievement of DC charter students by 5%. In 4th Grade math, district students scored a very large gain, but charter students achieved an even larger improvement.

DC charter 3

On 8th grade math, district students demonstrated impressive gains, but DC charter students were 19% more likely to score “Basic or Better.”

DC charter 4

Hopefully the race to excellence will continue and even accelerate. Meep! Meep!


A Closer Look at DC NAEP Scores

January 12, 2012

(Guest Post by Matthew Ladner)

A few months ago, I provided a quick analysis of DCPS NAEP scores under Michelle Rhee. Having looked into the fine details, I believe that I underestimated the positive trend in DCPS reading scores during the 2007-2011 period.

NAEP has long dealt with a tricky issue with varying inclusion rates for special education and English language learners between jurisdictions. In 2011, the NAEP adopted inclusion rate standards for ELL and SD students, and notified readers of jurisdictions that violated those standards in an appendix.

Some states and jurisdictions had far more successful efforts to comply with these efforts than others. As you can see from the figure below, DC would have been far out of compliance with these standards (had they been in place) during the 1990s and (especially) in 2007. In 2007, DCPS had excluded nearly three times as many students as permissible under the 2011 standards.

So in 2007, DCPS officials excluded 14% of students from 4th Grade NAEP testing, and in 2011 that figure fell to 3% (the inclusion for all students standard in 2011 was 95%). In 2007, DCPS stood far out of compliance, but came well within compliance in 2011. This is all well and fine, other than the fact that it complicates our ability to assess the recent history of DC NAEP gains.

In order to get a clearer picture on this, I decided to run 4th Grade NAEP scores for students outside of ELL or special education programs. This should minimize the impact of inclusion policy changes. Examined in this fashion, you get the following results:

Recall that the unadjusted total scores for 4th grade reading jumped from 197 in 2007 to 202 in 2009 but dropped back a point to 201 in 2011. That is a four point gain in four years, which ranks in meh territory. Given Figure 1 above, I am not exactly inclined to trust those scores, and in fact out second table tells quite a different story: general education students in DC made a 10 point gain between 2007 and 2011 on 4th grade reading. Ten points approximately equals a grade level worth of progress, so it is fair to say that DCPS general education 4th graders were reading approximately as well as 2007 general education 5th graders. Ten points ranks as the largest reading gain in the nation during this period for these students. Mind you, a 209 score for non-Ell and non-special ed students is still terribly low. Only gains will get DC out of the cellar, however, and DC banked solid gains during this period.

If you combine 4th and 8th grade reading gains for general education students, and only look at Free and Reduced lunch eligible students for a bit of socio-economic apples to apples, here is what you find:

DC students had the largest general education 4th grade reading gains in the country, and tie for first in the combined 4th and 8th grade reading gains. The District of Columbia, in short, made very substantial reading gains during the 2007-2011 period.


The Book on Rhee’s DC tenure: Pretty Good, Let’s Move On

November 4, 2011

(Guest Post by Matthew Ladner)

I mentioned a couple of weeks ago that the 2011 NAEP would be the first real book on Michelle Rhee’s tenure running DCPS. The 2009 NAEP was a little early, and the 2013 numbers and those going forward will be owned increasingly by those in charge after Rhee, for better or worse.

So this morning I tried to devise a rough and ready analysis that would be informative (if certainly not definitive) and that I could run before making breakfast for the kids (Mrs. Ladner is off on a well-deserved vacation, daddy is gasping for air).

Here is what I came up with: Rhee took command in 2007, so I use the 2007 NAEP scores as the baseline. We all know the level of academic achievement is terrible in DC, but it was when Rhee got there as well, so I decided to focus on growth in scores.

Finally, DC has experienced a good amount of gentrification in recent years, so I chose to focus on the growth of free and reduced lunch eligible children on all four main NAEP exams (4R, 4M, 8R, 8M) for the 2007-2011 period.

Here’s what came out:

That’s pretty close to the top. Rhee’s critics will be quick to note that DC’s gains between 2003 and 2007 were also large. We of course can never know the counterfactual DC’s scores may have been due for a stall, or they may have kept up the same pace whether Rhee had shaken the District up or not. We’ll never know.

The most important point is: DC scores are still a disaster despite the large gains before, during and after Rhee. Rhee has moved on, but the rotten scores are still there.

DC policymakers, in my opinion, should now look to take a deeper dive on reform. Why does the District’s budget continue to swell when the enrollment continues to shrink? If money were allowed to truly follow the child, you’d see an even more robust charter school movement in the District.

When will the District finally clean up the special education disaster? Many blame it on the lawyers, but go and look at the scores in the post below: these guys are shooting fish in a barrel. Special needs vouchers could play an important role in a comprehensive plan to clean up the special needs mess in DC (no litigation, no ultra-Cadillac placements).

While the needle is moving in the right direction in DC, I believe that the Cool Kids came out of the experience sadder, wiser and undeterred. That’s for the best.


DC NAEP Scores-Where is the Death Spiral?

May 13, 2010


(Guest Post by Matthew Ladner)

No one seems to be taking much note of it, but some Washington DC has some very favorable trends in their NAEP scores.

To be sure, the District’s scores still reflect widespread academic failure on an inexcusable level for a district blowing through $20k per child per year. The positive trend predates Michelle Rhee’s tenure, which is good, as I think we are likely to see further (badly needed) progress. It is still too early to judge whether Rhee will accelerate this rate of progress, but I’d be willing to bet she will.

If you go to the NAEP page for DC and look at the 4th grade reading scores, you will find that the catastrophically low score of 188 in 1992 fell to an even more pathetic 179 in 1994.   That’s almost a grade level drop from an already low base. A score of 179 makes me wonder what the score would be if we simply gave every child in DC a library card and hoped for the best. Mind you, that wouldn’t work well either, but it couldn’t work that much worse than DCPS circa 1994. Since 1994, however, scores have climbed 23 points. The percentage scoring basic or better increased from 24% in 1994 to 44% in 2009. Math improvement has also been impressive and shows the same trend- progress after the mid 1990s.

One blindingly obvious cause for the improvement: the 100 charter schools operating in the district educating over 30,000 children. DC’s charter law passed in 1996 (near the bottom of DC performance) and the opening of schools has been very strong. In 1996-7, DCPS had 78,648 students enrolled. In 2007-08 it had dropped to 58,191.

This is no doubt why DCPS spending per pupil has spiralled to such absurdly high levels. No on apparently thought that it might be appropriate to cut the budget for a district that is 20,000 fewer students, but I digress. DC’s scores still stink, but in the progress department they have clobbered all states other than Delaware and Florida.

I’m not willing to celebrate a district that spends over $20k per student per year and has 56% of 4th graders illiterate. I am however willing to celebrate progress, and DC has momentum. If they would like to accelerate that progress, parental choice policies that would be helpful would be to reverse the shameful decision of the NEA robots majority of the Democratic caucus to kill the DC Opportunity Scholarship Program. The program merits not only renewal but a large expansion.

In addition, DC should institute a McKay Scholarship program with children with disabilities, if they would like to stop paying for the 5th homes and country club memberships of the attorneys endlessly battering DCPS on failure to provide FAPE under IDEA. Both the kids and the district budget would win big from such a program.

The enemies of parental choice have always painted the nightmare scenario of an academic death spiral for the children “left behind” in the district. Perhaps these same folks would like to explain to us now how it is that DCPS lost a quarter of their students since the mid 1990s and watched their reading scores improve by 23 points. Where is the death spiral? Oh, I mean in DCPS scores.  The death spiral for the credibility of choice opponents is impossible to miss.


%d bloggers like this: