Guess which state had the largest overall NAEP gains in 2013…

July 13, 2016

(Guest Post by Matthew Ladner)

I’ve already been happy to report that measuring NAEP gains between 4th grade scores in 2011 and 8th grade scores in 2015, Arizona banked the largest overall gain in achievement. Just out of curiosity I decided to rank the states during the previous period (2009 to 2013) the same way- 4th grade scores in 2009 compared to 8th grade scores in 2013. I did this separately for Math and Reading.

Any guesses on which state came in first in overall gains? Here is a few clues:

Arizona wins again! First in overall math gains, fifth in overall reading gains, highest overall combined ranking. Feel free to pop out and take notes- we’ve been doing this since (at least) 2009. Yes, feel free to bring your golf clubs.

Oh yes- I almost forgot:


The MacKenzies Weigh in on the 2015 NAEP gain Champion

July 6, 2016

(Guest Post by Matthew Ladner)

MM: Hows it goin eh? So I am Matthew MacKenzie, and this is my sister Lisa Graham Mackenzie…put on your touk!

LGM: <putting on hat> COO LOO COO COO COO COO COO COOOOOOOO! Good day!

MM: Good day! Sos our topic today is education…

LGM: Education? Do you need me to teach you how to open a beer again hoser?

MM: No! Ifs I didn’t learn that after the sixth lesson or so, I’da thirsted to death already!

LGM: You….learn? <snorts>

MM: Yeah….okay…..so good day, we are here today to talk about education in the United States.

LGM: They have education in the United States? I thoughts the test scores were even lower down there than yours hose-head?!?

MM: Yeah, well, they are, check out how high Canada is on this ranking eh!

MM: You may have to squint but Canada is near the top! United States, er, well but at least some American states are making progress…like getting a lot better…

LGM: Oh you mean like BEER! Remember when just a small number of breweries made almost all the beer, and it mostly tasted like stagnant pond water?

MM: Yeah- kinda like that! So’s now some states have kinda done the microbrewery thing for schools eh? Sos more people can find a school that they like!

LGM: Beauty! And hosers like you can find a beer you like!

MM: Yeah so the state with the biggest gains did microbrewery education in a big way eh? Ands you can read about in our column in the Arizona Republic!

LGM: What’s the Arizona Republic?

MM: You know, it’s like the Moose Jaw Times Herald, but even better and for Arizona!

LGM: Okay…So if they keep making gains they might be able to do advanced Canadian math problems like this one:

MM: Yeah…that’s what we call “applied math” up here in the Great White North!

LGM: Beauty! So we wrote a column and it ran, like, in the newspaper?!?

MM: Yeah!

LGM: Sos why does this post have a MacKenzie theme eh?

MM: Take off- you’ll have to read the column to find out, eh?

LGM: You take off hose-head!

MM: Okay so that’s our show for today eh…good day!

LGM: Good day!


Remarks to the Arizona Chamber of Commerce: More Than This

June 20, 2016

Friedman award

(Guest Post by Matthew Ladner)

The Arizona Chamber of Commerce and Industry held an awards breakfast last Friday, where they recognized a number of worthy recipients including friends serving in the legislature like Senator Debbie Lesko and Senator Steve Pierce and Representative Paul Boyer.  They also however chose to recognize a rather dubious character with whom you will be all too familiar by bestowing upon him the Milton Friedman Award, Obviously I was deeply touched to receive an award named after one of my heroes.

At the request of the Chamber, I prepared the following remarks:

I am deeply touched to receive this honor, but I must say that I feel a bit like Jack Ryan. You may recall the scene in the Hunt for Red October when Ryan exclaims “Me?!? I’m just an analyst!”

Arizona is sailing into history!

While I am deeply appreciative of the award, it is I should honor you. The groundwork for what I am about to describe was already in place when I arrived in Arizona in 2003. You as long-time business and civic leaders in Arizona should take great pride in what I will relate.

It was recently reported that Arizona ranks number two in job growth. I am happy to relate to you that Arizona ranks number one in K-12 academic gains.  The National Assessment of Educational Progress gives academic exams to 4th and 8th graders in all 50 states every two years. When you follow the academic progress of 4th graders in 2011 to when they became 8th graders in 2015, you find that Arizona students made more progress than any other state. Given everything this state endured during the Great Recession, this is a remarkable tribute to the resiliency of our students, educators and policymakers.

NAEP Math cohort gains with AZ charters

This progress is across the board and includes both district and charter schools. In addition our charter school students did something truly extraordinary. On the same 2015 National Assessment of Educational Progress, Arizona’s charter school students scored comparably to the highest performing states like Massachusetts and New Hampshire. This is all the more impressive when you consider that Arizona charter schools are funded far more modestly, and have student bodies far more diverse, than the schools in New England.

These results are remarkable. How did this happen? What is the secret sauce? There is no single explanation and there are many ingredients in the Arizona K-12 reform gumbo. You made the mistake however of giving me an award named after the great Milton Friedman and then the even larger mistake of giving me the microphone, so I am going to talk about parental choice. It seems clear to me that parental choice has been a major contributor to Arizona’s improvement.

Parental choice is controversial. Some people believe that parental choice is about some schools being “good” while others are “bad.” Those who believe this however are mistaken. Parental choice is about the fact that every single child deserves to have access to a school that is a good fit for them. Good fits between students and schools are very powerful, and we cannot replace it with any other source of improvement.  Without giving parents the ability to match the needs and interests of their child with the particular strengths of a school, the public education system will never reach full potential.

During the campaign, Governor Ducey quite rightly placed an emphasis on Arizona students sitting on wait lists at our high demand district and charter schools of choice. These students only have one shot at their K-12 education, but they find themselves stranded by the inadequacies of our policies, waiting for the opportunity to attend their good fit school. Meanwhile the sand continues to run through their hourglass. 

Our challenge includes this, but it is also more than this.

Tens of thousands of Arizona students sit on wait lists, but hundreds of thousands of Arizona parents never even considered some of our highest performing district and/or private schools. These schools may have been great fits for the needs of their children, but they didn’t even cross the radar screens of these parents for consideration. Why not? Because they have effectively been priced out of consideration. Parents either cannot afford the high price of real estate for the district schools, or else cannot afford to pay tuition in addition to their taxes. Many sadly see these schools as being for someone else, but not for them. It doesn’t however have to remain this way. We have it in our power to make our educational opportunities more inclusive. The blessings of liberty should not remain the privilege of the few, but rather the birthright of all.

I fell in love with Arizona because of our innovative spirit and I believe that we have been richly rewarded for it. If Dr. Friedman were still with us, I believe he would be proud of what we have done, and would encourage us to do more. Arizona is a state with big horizons, where the sky is the limit. May we always remain so.

I genuinely am deeply appreciative of both the award, and the opportunity to work with great people on these issues in Arizona.


Time Vault Tuesday- Six-year checkups on 2010 Predictions

May 31, 2016

(Guest Post by Matthew Ladner)

The Western Free Press unearthed an Arizona Horizon video from 2010. I was at the Goldwater Institute at the time, and we had Governor Jeb Bush and Foundation for Excellence in Education President Patricia Levesque out to the cactus patch to discuss Florida reforms in Arizona. The Arizona legislature went on to enact two of the key Florida measures-school grading and literacy based promotion, during that legislative session. The video makes for a great time vault to explore predictions at the time.  Notice that the discussion in the video between myself and John Wright, the then-President of the Arizona Education Association, mirrors the later orbit of Mercury discussion– I predicted that we could make academic progress despite our economic difficulties, Wright predicted failure and doom without more money.

Here is a key prediction from Patricia:

If Arizona does some of the policies that are floating through the legislative process right now, you won’t see immediate results. I will take time, it takes determination, it takes a comprehensive set of policies that makes sure that the focus is on student learning, but Arizona could be where Florida is in a decade.

So let’s check the tape, or rather, check the NAEP. Mind you, there are many ingredients in the complex Arizona K-12 gumbo, so I would not wish to claim a simple causal relationship between these policies and outcomes.  Nevertheless the general drift of Arizona policy has been towards greater levels of parental choice and improved academic transparency, which are things our tribe supports. This recording was made in 2010, which means the reference point at the time would have been the 2009 NAEP. Has Arizona made progress towards getting to where Florida was in 2009? It’s six years later, so Arizona has some sand left in the hour-glass, but have we made progress?

Answer- yes Arizona in fact is ahead of schedule overall.

On all four NAEP exams, Arizona has either substantially closed the gap on where Florida stood in 2009 or else (in the case of 8th grade math) already exceeded where Florida stood at the time. The largest gap remains in 4th grade reading. In 2009 a sixteen point gap yawned between Florida and Arizona. In 2015 Arizona’s scores were 11 points behind where Florida’s stood in 2009.  The gaps on the other three exams however have been substantially narrowed. On the 8th grade side, Arizona basically entirely closed the gap with their 2015 scores and where Florida stood in 2009.

Here’s another prediction, made by yours-truly when asked about increasing spending.

Right now we face a gigantic structural budget deficit and I think that whether the sales tax proposal passes or not the truth is that there is not going to be any money for any increases in public school spending any time soon. In fact there is likely to be cuts. Having said that, I think that it is absolutely still possible for us to make progress, to get better bang for the buck the way Florida has whether that new money materializes or not.

John meanwhile generally expressed skepticism regarding the Florida reforms, and described funding cuts as “pulling the rug out from under” teachers. So how does this look, six years on?

NAEP Math Cohort gain 2015

The video was from 2010, and little could we have known that Arizona students were poised to lead the nation in 4th to 8th grade NAEP gains between the 2011 4th grade NAEP and the 2015 8th grade NAEP.  The predicted funding cuts did in fact come to pass, which was very unpleasant for those running our schools, but meanwhile our students showed the rest of the country how it is done on gains. Time to CeleNAEP!


The Unknown History of the Mother of All K-12 Competitive Effects

May 24, 2016

(Guest Post by Matthew Ladner)

How did this happen?

NAEP Math Cohort gain 2015

As per usual, there is no one single simple answer, but the elephant sitting in Arizona’s K-12 room over the last decade has been abrupt and bracing change in a decades long trend of district enrollment growth and funding increases.  Arizona has experienced more than a century of population growth as the rest of you figured out that it was possible not to dig your car out from the snow, and even to play golf in February in Arizona. Arizona K-12 enrollment boomed for decades, with almost all of it going to the districts. In 1995 the first charter schools opened, but at first they were like little mammals scurrying around fearfully in the Age of Dinosaurs.


AZ enrollment growth

During the booming age of plenty, the districts were not only getting ever more students, but the spending per pupil steadily increased. Arizona has never been a wealthy state and has long had a relatively small working age population due to the presence of beaucoup retirees and children (relatively large LDS families, immigrants etc.) so this increase was even faster in most states, but was still very large in Arizona:

AZ spending


So in this sort of lost, antebellum Arizona of pre-2007, the school district folks would complain about more of these charter schools popping up, but really they were just whining- spending per pupil had been going up, and they had more pupils than they knew what to do with. Mind you the NAEP of 1992 showed that only 28% of Arizona Anglo students could read proficiently in “English” so a reasonable person could conclude that the districts and their swelling enrollment and growing funding could use a little competition.

As fate would have it, they got competition with both barrels after 2007. In fact, I will have to nominate Arizona as having gone through the mother of all competitive effects.

The Great Recession hit Arizona early and hard. Arizona’s general fund dropped 20% in a single year. When your main industry is building houses on golf courses and all of the sudden everyone nationwide has a difficult time selling their house, your economy takes a beating something like:

Great Recession SMASH AZ economy! Great Recession is the STRONGEST ONE THERE IS!!!!!

I…..wish…..I……could…………spend..more……on……..schools!

So the federal stimulus and a temporary sales tax increase engineered by former Governor Jan Brewer temporarily staved off cuts, but they were eventually necessary and they were not insignificant:

AZ spending

At the same time per pupil spending declined, enrollment growth came to a screeching halt in the districts, in part because of the continued growth of charter schools:

AZ enrollment

Now mind you that the absolute size of district enrollment was quite modest, but the normal experience for Arizona schools had been non-stop growth for decades.  That growth not only stops and reverses a bit, but state assistance per pupil declines as well. Thus at exactly the same time you might want to make up per pupil funding losses with more pupils, you suddenly stop getting as many pupils.

Now as I have written about before, the Newtonian model of K-12 mechanics would have concluded that Arizona’s NAEP scores would have declined under the weight of this pressure. (In fact, Mike Petrilli still owes LGK and I beers on that front….hmmmm….interest accruing daily btw.)

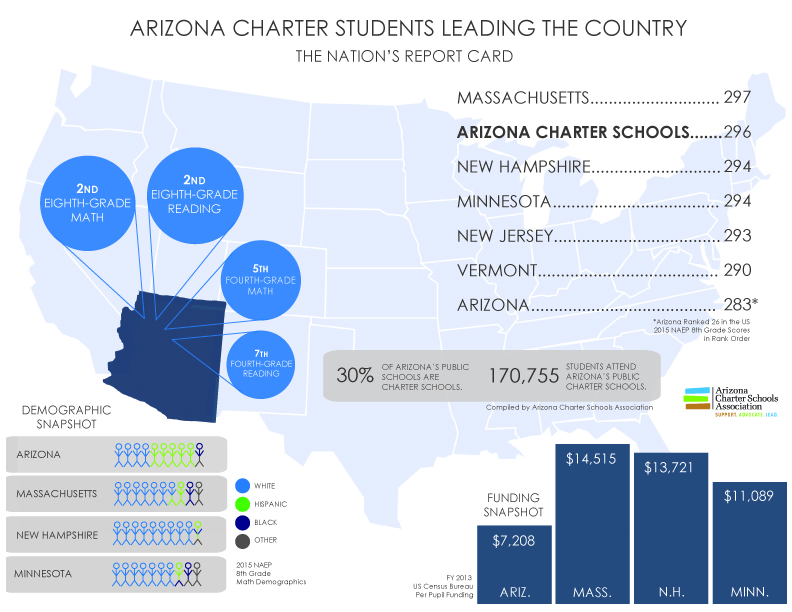
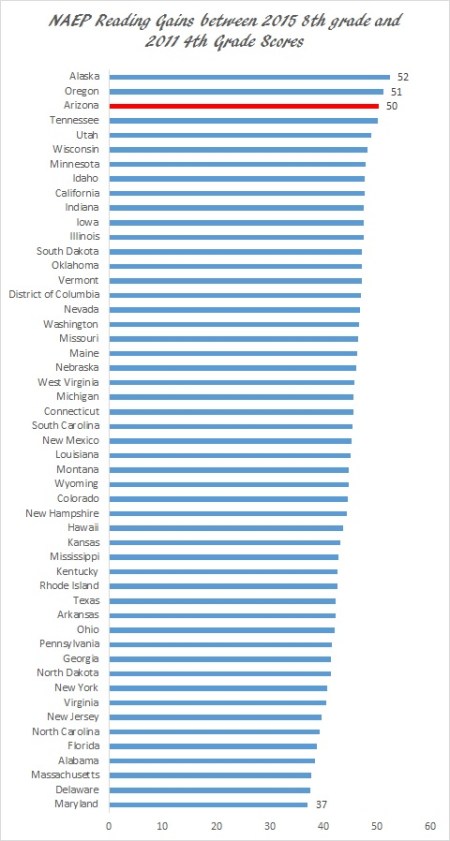
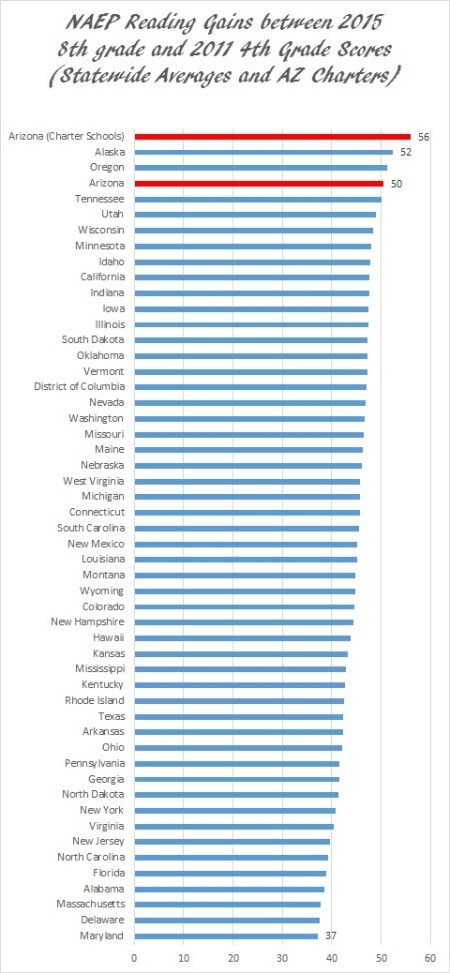
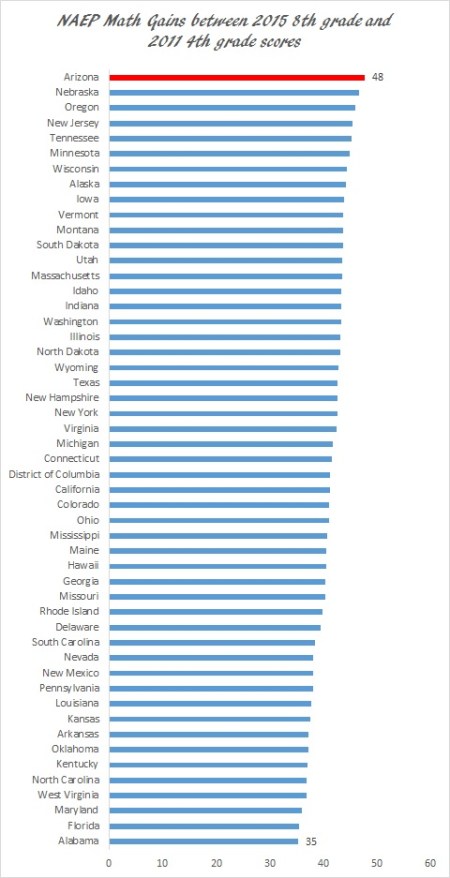
What actually happened during the Great Recession however is that while the economy was smashed, outcomes in schools continued to improve, even defying the national trend in the 2015 NAEP. As the first chart in this post shows, Arizona’s students made more math progress between their 4th grade scores in 2011 and the same age cohorts scores as 8th graders in 2015 than any other state. What gives?

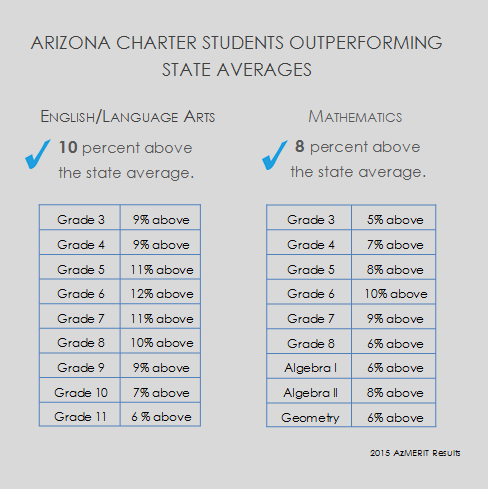
While funding decreased, competition for students increased. An ever higher percentage of students continued to apply to attend charter schools and their waiting lists continued to swell.  Fancy Scottsdale Arizona somehow has a couple of empty schools. The state wisely moved to outlaw LIFO in school district layoffs, because layoffs were necessary. A skillful school leader would have taken the opportunity to preserve as many highly effective teachers as possible in this process.

In short, this was a productivity increase that you see in private industry on an ongoing basis. Arizona schools became less expensive and more effective. It is however at complete and utter variance with the state’s history of ever growing budgets and students along with relatively stagnant scores.  The Mother of All Competitive Effects (so far) was great for kids and taxpayers, tough on providers and it came about as a combination of deliberate policy and accidental economic catastrophe.

Where do we go from here? Proposition 123 will provide an extra $3.5 billion over the next 10 years, the baby boomer teacher cohort will continue to retire and need replacing, new charter schools will continue to open. Enrollment growth has already returned but the working age population will continue to shrink as a percentage of the total population.  The need for further academic gains remains acute. In short, the need for a less expensive and more effective education system is not going away, nor will the political battles surrounding the K-12 debate.

If however Arizona policymakers play their cards skillfully, the state can continue its ongoing move out of the NAEP cellar and towards a world class system of education. Some Arizona schools have already arrived at this enviable spot.

The challenges are very real, but the sky is the limit on our opportunity to improve.


Arizona is the NAEP Value Added Champion of 2015

May 16, 2016

(Guest Post by Matthew Ladner)

Tom Patterson recently wrote a column about Arizona NAEP scores, and stated that Arizona had the highest overall gains in combined Reading and Math scores between the 2015 8th grade scores and the same cohort of students 2011 scores as 4th graders.  I decided to check it out.

NAEP has been following an odd number year cycle, meaning that the four-year gap between the same cohort of student can be measured. In this case, I took the statewide 2015 Math scores and subtracted from them the statewide 2011 4th grade math scores. We more commonly compare 8th grade scores to those of previous 8th graders, but measuring cohort gains is also of interest.

A note of caution before proceeding it is possible to do well on the below gains analysis without ranking terribly high. Likewise you could have the highest overall 8th grade scores but also had high 4th grade scores four years earlier and look meh in this particular analysis. Like achievement gaps, each state’s gain score requires a close look before drawing conclusions- but generally speaking the states with the biggest scores below would have started with modest 4th grade scores and then shown much higher scores for the same students as 8th graders. Obviously factors other than school system effectiveness could come into play (massive gentrification in the District of Columbia comes readily to mind) and every state will have students both come and go between 2011 and 2015.

Okay now that you’ve read the warning label:

NAEP Math Cohort gain 2015

In terms of context, Arizona’s 4th graders scored 5 points below the national average in 4th grade math in 2011 but two points higher in 8th grade math in 2015. There is nothing about starting below the national average that makes it inevitable you will crush the ball in gains. Alabama for instance had 2011 4th grade math scores 9 points below the national average but then displayed 8th grade scores in 2015 that were 14 points below the national average.

Reading gains below:

NAEP Reading Cohort gain 2015

Arizona’s 4th graders scored 8 points below the national average in 4th grade reading in 2011. As 8th graders in 2015 however this group of students had scores only one point below the national average- within the margin of error thus catching them up to the national average. In short, Tom Patterson nailed it- AZ looks to have had the best 2011 to 2015 period.

So this got me to thinking-what if we tracked the same cohort gains for Arizona charter school students and compared them to statewide averages? As we’ve noted before, with the largest state charter sector as a percentage of the population, Arizona has substantially more students than the entire public school system of Wyoming. The National Alliance of Public Charter Schools also compiles data about state charter sectors, so we know that the sector (like Arizona as a whole) has a majority minority student body.

Well this is what it looks like for Math:

NAEP Math cohort gains with AZ charters

Keep on rocking the free world! Similar story with reading:

NAEP Reading Cohort gain 2015 AZ charter

Given the Arizona’s charter schools rank near the top in over NAEP scores, and first in overall NAEP cohort gains between 2015 and 2011, they have a great deal to celebrate- as does Arizona as a whole. Nothing in these results makes a case for complacency Arizona has only numerically exceeded one of the national averages on the four main NAEP exams, and America remains a low performing nation. Nevertheless if this is what getting an F on the Ravitch report card looks like, what can we do to get an F minus minus?


Arizona Gains and the Orbit of Mercury-Wrecking Balls for Flawed Paradigms

December 21, 2015

(Guest Post by Matthew Ladner)

Recently I made an off-hand comment about Arizona NAEP gains being like the problem with the orbit of Mercury. I decided that it would profit from some further explanation. Newtonian mechanics seemed to have everything figured out, with that nagging problem of the orbit of Mercury doing something it shouldn’t. The “problem” with the orbit of Mercury of course wasn’t really a problem at all. It turned out to be a problem with our incomplete understanding of how the universe works- as illustrated in the above video.

Arizona 8m NAEP

So just how do Arizona NAEP scores resemble the orbit of Mercury? The 2015 NAEP shows that Arizona charter school students scoring in the range of New England states. Arizona charter schools serve a majority minority student population and spend only $8,041 per student- about a thousand less per student than Arizona districts and far less than the average spending in New England states.

AZ charter vs. district

Arizona’s AZ Merit exam demonstrated even larger gaps between charter and district scores than the NAEP, providing external validation for the NAEP scores.

Moreover Arizona charters, like districts, have been operating in a very tough environment. Back in my Goldwater Institute days, I would go to the Joint Legislative Budget Committee website as a rich source of for refuting complaints about public school spending. As it happened, the districts were getting more students, and the spending per pupil was climbing. Cry me a river. The Great Recession however clobbered the housing dependent Arizona economy and the same document now shows that the Great Recession shot Arizona school funding in the arm, punched the gunshot wound, and then threw us out through the front windshield.

Look at those guys! Their NAEP scores are going to collapse!

A little before the release of the 2015 NAEP, Mike Petrilli offered a friendly bet of a beer to me and Lisa Graham Keegan that Arizona’s NAEP scores would go down between 2013 and 2015 based on economic difficulties. We both instinctively thought they would go up, and they did. We are thirsty Mike! Taking a longer term view of the entire Great Recession period however proves more revealing.

AZ Mercury 1

Arizona scores have improved at six times the national rate on 4th grade math, 7 times the national rate on 8th grade math, five times the rate on 4th grade reading and 2.67 times the rate on 8th grade reading. How did a state that saw a decline in inflation adjusted spending per pupil drop from $9,438 in 2007 to $7,828 in 2014 (see JLBC doc link above) manage to outpace the nation in progress by such a wide margin? District interests here have a non-stop mantra about Arizona’s relevantly low ranking in per pupils funding but, er, why are we outpacing the nation by such a wide margin even as our funding declines?

Whoa- that’s unpossible!

Something is wrong here- but it is not Arizona’s positive score trends. What is wrong is some very common assumptions about K-12. I’ll get to that below.

The reality of Arizona K-12 improvement is of course complicated and defies any single explanation, with big changes going on at the same time. One factor that obviously contributed and that we can quantify charter schools. The next figure shows the NAEP gains by subject/grade for Arizona students for districts and charters (2015 scores minus 2007 scores).

Arizona Mercury 2

Some may attempt to dismiss the difference between charters and districts as a product of differences in student populations. Only a random assignment study could definitively test this assumption, but a large amount of evidence suggests which way such a (sadly non-existent) study would fall. Arizona charter students rank well when compared to statewide averages when compared to a wide variety of subgroups (general ed, White, Hispanic, etc.) While differences in student populations could explain some of the differences between Arizona charters and Arizona districts, they can’t be put to similar use in explaining why Arizona students outscore similar students in New Hampshire. Arizona law also require random lottery admissions, serve a majority-minority student population and the improvement we see in the district scores does not exactly sit comfortably with a massive brain drain to charters story. If all of Arizona’s brightest students were fleeing to charters, it would put a substantial drag on district scores. Instead we see district scores improving.

Arizona has a higher percentage of students attending charters than any other states, but that still only falls in the teens– 13.9% in 2012-13. Even so these gains are large enough to make a noticeable difference the aggregates:

Arizona Mercury 3

The differences in the above charts only display direct impact of charter school scores the statewide average. We have substantial reason to believe however that the growth of charter schools has indirectly raised Arizona scores as well through competition. In other words, charter schools almost certainly deserve some of the credit for the blue columns in the above chart rather than merely the difference between the red and the blue.

The reason I was willing to take Mike’s friendly bet on 2015 NAEP scores- I believe that by far the greatest opportunity to improve K-12 lies in making more efficient use of existing resources. In the opening pages of his 2004 book Hard America Soft America: Competition vs. Coddling and the Battle for the Nation’s Future the astute observer Michael Barone noted the following:

Public schools for example may be the most notable example of a predominantly Soft institution-which helps explain why American children are confined mostly to Soft America. But as we will see, our schools have not always been so Soft; they have contained corners of Hardness, and there are signs they are getting Harder now.

“Coddling” is not a term one would use to describe Arizona public education during the 2007-2015 period. Declining spending forced both district and charter leaders to seek efficiency. The state passed a law forbidding schools from making reduction in force decisions exclusively on length of service- this was very wise. Ineffective/expensive workers should be the first to go in a reduction in force- the alternative being to RIF a much larger number of young employees regardless of their effectiveness. Federal stimulus and a temporary sales tax increase delayed the need for these adjustments-but only temporarily. During this period Arizona lawmakers began grading schools A-F, and the combination of (mostly) recession related slow population growth and expanded competition halted what had been a non-stop process of student population growth for districts. Charters continue to gain market share against districts- and now both a more rigorous state test and NAEP show a substantial academic advantage for charter students.

None of this is easy for district leaders. It’s not exactly the cold howling wind of market competition, but it is a much higher level of competition and transparency than that to which the K-12 folks feel accustomed. Their world has become less stable and more competitive-Harder to use Barone’s phrase. To their credit, many district leaders have embraced the challenge.

It’s very difficult. It’s also very good for children. 


Best Organized Spontaneously from Below

December 15, 2015

(Guest Post by Matthew Ladner)

So half way through reading Matthew Ridley’s new book The Evolution of Everything I come across a perfect distillation of the background meta-narrative of the JPGB in the last paragraph of Chapter 13:

The elite gets things wrong, says Douglas Carswell in The End of Politics and the Birth of iDemocracy, ‘because they endlessly seek to govern by design in a world that is best organized spontaneously from below.’ Public policy failures stem from planners excessive faith in deliberate design. ‘They constantly underrate the merits of spontaneous, organic arrangement, and fail to recognize that the best plan is often not to have one.’

Out here in AZ- a central planner’s K-12 nightmare of Wild West chaos-since the bust of 2007 we’ve had NAEP gains between 2.5 to 7 times greater than the national average. What passes for a consensus on Newtonian mechanics back east will struggle to explain this- something is wrong with the orbit of Mercury! Best perhaps to ignore outcomes entirely- as the New York Times did in an article this summer about AZ K-12:

Arizona in particular has been crippled by several years of targeted cuts at the state level and local voters’ repeated refusals to raise property taxes to offset these shortfalls.

Thank you for your  touching concern NYT, but I’m feeling pretty handi-capable about right now. I know states with budget cuts and dysfunction in central command are not supposed to make nationally enviable academic progress during a very trying period. We alas didn’t get the memo out here in the patch so we went and did it anyway.

Oh and by the way Arizona style austerity of the 2007-2015 variety may make a nasty appearance in a state near you in the near future. Feel free to pop out and take some notes on how to thrive through it- and yes you can bring your golf clubs.


AZ Charter Scores are Real and They’re Spectacular!

December 8, 2015

(Guest Post by Matthew Ladner)

AZ charter vs. district

Let’s the speculation shift from “are those AZ charter NAEP scores real?” to “did the NAEP underestimate the scores?” As the lovely Teri Hatcher once said:


CeleNAEP for AZ Charters continues in AZ Merit Scores

December 4, 2015

(Guest Post by Matthew Ladner)

Laissez le bon temps rouler! The AZ Department of Education released results of the new AZ Merit test, and the Arizona Charter School Association released a breakdown of the scores showing that AZ charter school students scored 5%-12% higher scores depending upon the grade level/subject (see below).

Sadly the AZ Merit data comes in the form of an excel spreadsheet rather than a NAEP-like data slicer, so a control for differences in student demographics, program status, etc. cannot be readily performed. Some of the differences in scores between AZ charters and districts are likely to be explained by student differences. When you examine the NAEP, it is also the case that some of the differences between New England states and a state like Arizona will also be explained by student differences. No one I know however doubts that the average public school in MA outscores the average public school in AZ.

AZ Merit aligns much more closely to NAEP in terms of student results than the jumped the shark over a decade ago AIMS test. The differences observed in raw scores are generally larger than those existing between the top NAEP state (MA) and Arizona. The AZ Merit scores therefore reinforce the NAEP data’s finding that Arizona charter schools have something special cooking out in the cactus patch.

Korea- your scores are next!