So Lisa Graham Keegan and I finally had the opportunity to collect on our bet with Mike Petrilli on the 2015 NAEP. You may recall that Mike bet us before the release of the 2015 NAEP results for Reading and Math that Arizona’s NAEP scores would decline. Using our spidey-sense, LGK and I bet Mike that they would be going up, not down. Arizona’s NAEP scores did go up. Mike was a good sport and quite appropriately paid his debt to us in copper cups (one of the state nicknames is the Copper State).
Depending upon how you examine the data Arizona is either near or else is at the actual top on gains. Measured by student cohort over time, Arizona’s 4th grade class of 2009 made more progress on Math and Reading between 4th and 8th grade scores in 2013 than any other state. Arizona’s 4th grade class of 2011 achieved the same pinnacle in their 2015 scores as 8th graders. (NAEP Math and Reading exams are both scaled and timed to allow such comparisons). The gains for Arizona charter school students dwarf those of Arizona as a whole, or any other state.
So anyhoo, the term “Wild West” is being thrown around as if it is a term of derision by some of those uncomfortable with the selection of Betsy DeVos as Secretary of Education. Here in the actual Wild West we wear the term with pride. The Arizona charter school sector has a majority minority student population, scored like a New England state on all six NAEP exams, and shows consistent results on the state PARCC exams.
Let me know when your state pulls something like that off, because I will be happy to celeNAEP with you. In the meantime, NAEP will be giving state level exams in Reading, Math and Writing in just a few weeks! Let’s see what happens next…
So hidden deep in the NAEP data explorer is a variable for school enrollment. Yesterday we saw how Arizona charter schools crushed the ball on the 2015 NAEP science exams, but I was curious- would there be evidence suggesting that small schools of choice perform especially well? NAEP provides such a number in a crosstab for Arizona charter/district by school enrollment. Small district schools in Arizona performance is nothing to write home about, and are probably mostly rural. Arizona’s small charter schools-schools of choice-however, well, that is a different story. These are the 8th grade science NAEP scores for Arizona charter schools with 399 or fewer students compared to statewide averages for all students:
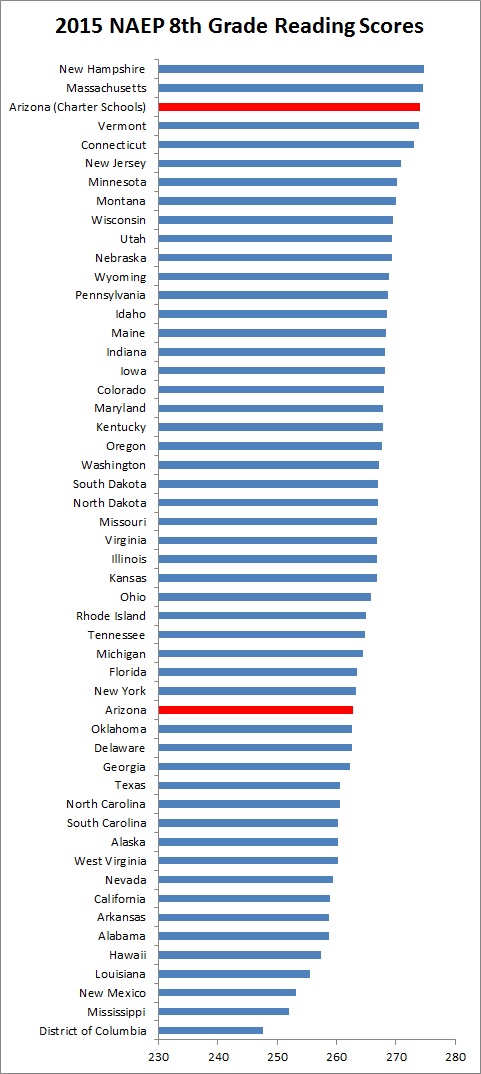
I thought that was interesting, so I checked to see how this would look in the 2015 NAEP Reading exam for 8th graders. Well-
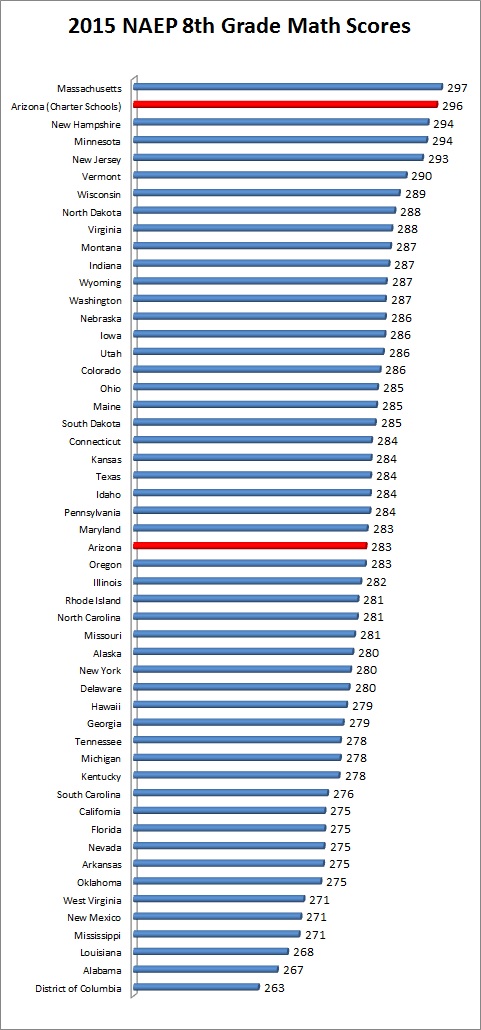
Well but the whole thing would fall apart in the math test. Except, it didn’t:
Obviously this evidence is only suggestive, but do keep in mind that we have a large number of formal studies finding positive outcomes associated with attendance at small high schools. So perhaps high quality education involves authentic community with a shared vision of what constitutes high quality learning, and this process is facilitated by the ability of a child and parent to choose. It certainly appears to be the case out here in the Cactus Patch. Let’s call it the “Cheers theory of learning” in that you want to go where everybody knows your name. If that is you want to learn to read, figure some math, and understand science. If you prefer to fade into the background and then drop out of school- we’ve got plenty of Big Box schools to choose from as well.
So you see dare Normy dare used to be this big Foundation that had a great idea but then…
So I was looking at the National Alliance for Public Charter Schools Dashboard on state charter school sectors trying to figure out how the Arizona Charter sector managed to put it all together to rock the 2015 NAEP like a rock star on an epic hotel room thrashing bender. Just as a reminder, Arizona has long been known as a Wild West of charter schooling- liberal authorizing, relatively light-touch state oversight, etc. Just the sort of thing that a central planner hates. In addition, the sector is not generously funded by national standards, pulling in about $8k per student from all sources, and educates a majority-minority student body. Moreover the Credo analysis from a few years ago held its nose at AZ charter results. And yet, the 2015 NAEP comes in and shows AZ charter students scoring like a New England state in all four exams and these results are backed up by the state AZ Merit exam. What gives?
One possible factor- maturation:
Paul Peterson noted years ago that the Credo analysis of charter test scores had not controlled for two potentially important factors- let’s call them shakedown cruise and transfer effects. Like any social enterprise, a school is unlikely to be at peak effectiveness in the early going. In 2005-06 Arizona charter schools in years 1-3 outnumbered those that had been operating for 10 or more years three to one. Let the clock run a bit however and by 2013-14 old timers outnumber newbies by more than two to one. As far as transfer effects go, some brand new schools will have nothing but transfers, whereas established schools will typically be breaking in a new class of their youngest grade covered and some transfers. So we waited things out in Arizona and eventually we were rewarded with results like:
Well AZ charters- you are growns up, you’re growns up and you’re growns up!
Next factor: churn.
The National Alliance for Public Charter Schools notes that between 2010-11 and 2014-15, 215 new charter schools opened. During the 2010-11 to 2013-14 period 96 Arizona charter schools closed. So factoring in life cycle performance, those 215 that opened may have looked pretty meh when Credo checked in on them as youngsters, but perhaps they were just out having an ale with Falstaff and the gang figuring a few things out getting their sea-legs under them as young organizations.
Let’s assume further that those 96 schools that closed actually were worse than meh on average. Arizona grants 15 year charters, so the oldest of the lot did not start coming up for renewal from the Arizona State Charter School Board until 2010. Charters of course sometimes close due to factors other than state action as well, and academically fantastic schools will be greatly under-represented in this subset. So you open about twice as many schools as you close over the last few years but the ones you open are sorting things out and getting better, while the ones you closed just couldn’t cut it results in:
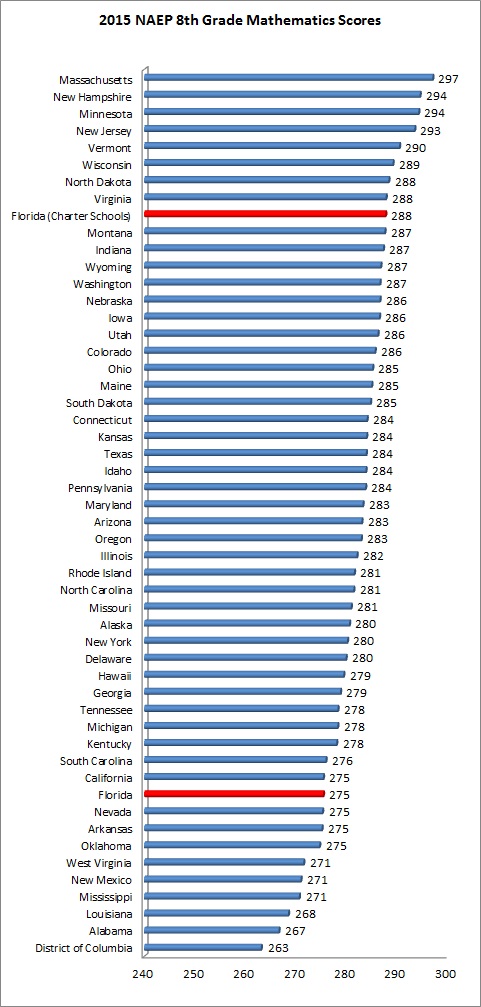
Florida’s charter sector also rocked the 2015 NAEP. How much did they rock the 2015 NAEP you ask? Well this much:
Florida charters seem to be doing something right. Possible maturation factor here as well? I’ll take “Sure Looks that Way to Me” for a thousand Alex:
The National Alliance shows about 300 new charters opening and 101 closing in Florida in recent years. You let parents pick schools that are good fits for their kids, open a new bunch of schools on their way to improving, and close sub-meh, guess what your majority minority sector can rock the NAEP like a New England state.
Now not every charter sector, even among the long-standing ones, sees these kind of results. Many factors can and will influence such scores besides those discussed here. For instance, Michigan charter schools look pretty bad at first blush, but a concentration in Detroit may have something to do with that. The ability to slice and dice the NAEP data has definite limits and multiple factors can be simultaneously at play. Minnesota however has the nation’s oldest charter law and seems to notably lack the sort of grand-slam ability of the Arizona, Colorado and Florida sectors. A lack of dynamism may be contributing while the average age of Minnesota charter schools has increased, very few new schools have been opening, and very few established schools closing- almost as though charters have their little niche but have been safely contained.
Last month Neerav asked “Is School Supply F***ing Everything?” Maybe so. Keep those new schools coming, let parents sort them out, and if parents don’t torpedo the low-performers don’t renew their charters. Otherwise sit back and enjoy!
Recently I made an off-hand comment about Arizona NAEP gains being like the problem with the orbit of Mercury. I decided that it would profit from some further explanation. Newtonian mechanics seemed to have everything figured out, with that nagging problem of the orbit of Mercury doing something it shouldn’t. The “problem” with the orbit of Mercury of course wasn’t really a problem at all. It turned out to be a problem with our incomplete understanding of how the universe works- as illustrated in the above video.
So just how do Arizona NAEP scores resemble the orbit of Mercury? The 2015 NAEP shows that Arizona charter school students scoring in the range of New England states. Arizona charter schools serve a majority minority student population and spend only $8,041 per student- about a thousand less per student than Arizona districts and far less than the average spending in New England states.
Arizona’s AZ Merit exam demonstrated even larger gaps between charter and district scores than the NAEP, providing external validation for the NAEP scores.
Look at those guys! Their NAEP scores are going to collapse!
A little before the release of the 2015 NAEP, Mike Petrilli offered a friendly bet of a beer to me and Lisa Graham Keegan that Arizona’s NAEP scores would go down between 2013 and 2015 based on economic difficulties. We both instinctively thought they would go up, and they did. We are thirsty Mike! Taking a longer term view of the entire Great Recession period however proves more revealing.
Arizona scores have improved at six times the national rate on 4th grade math, 7 times the national rate on 8th grade math, five times the rate on 4th grade reading and 2.67 times the rate on 8th grade reading. How did a state that saw a decline in inflation adjusted spending per pupil drop from $9,438 in 2007 to $7,828 in 2014 (see JLBC doc link above) manage to outpace the nation in progress by such a wide margin? District interests here have a non-stop mantra about Arizona’s relevantly low ranking in per pupils funding but, er, why are we outpacing the nation by such a wide margin even as our funding declines?
Whoa- that’s unpossible!
Something is wrong here- but it is not Arizona’s positive score trends. What is wrong is some very common assumptions about K-12. I’ll get to that below.
The reality of Arizona K-12 improvement is of course complicated and defies any single explanation, with big changes going on at the same time. One factor that obviously contributed and that we can quantify charter schools. The next figure shows the NAEP gains by subject/grade for Arizona students for districts and charters (2015 scores minus 2007 scores).
Some may attempt to dismiss the difference between charters and districts as a product of differences in student populations. Only a random assignment study could definitively test this assumption, but a large amount of evidence suggests which way such a (sadly non-existent) study would fall. Arizona charter students rank well when compared to statewide averages when compared to a wide variety of subgroups (general ed, White, Hispanic, etc.) While differences in student populations could explain some of the differences between Arizona charters and Arizona districts, they can’t be put to similar use in explaining why Arizona students outscore similar students in New Hampshire. Arizona law also require random lottery admissions, serve a majority-minority student population and the improvement we see in the district scores does not exactly sit comfortably with a massive brain drain to charters story. If all of Arizona’s brightest students were fleeing to charters, it would put a substantial drag on district scores. Instead we see district scores improving.
Arizona has a higher percentage of students attending charters than any other states, but that still only falls in the teens– 13.9% in 2012-13. Even so these gains are large enough to make a noticeable difference the aggregates:
The reason I was willing to take Mike’s friendly bet on 2015 NAEP scores- I believe that by far the greatest opportunity to improve K-12 lies in making more efficient use of existing resources. In the opening pages of his 2004 book Hard America Soft America: Competition vs. Coddling and the Battle for the Nation’s Future the astute observer Michael Barone noted the following:
Public schools for example may be the most notable example of a predominantly Soft institution-which helps explain why American children are confined mostly to Soft America. But as we will see, our schools have not always been so Soft; they have contained corners of Hardness, and there are signs they are getting Harder now.
“Coddling” is not a term one would use to describe Arizona public education during the 2007-2015 period. Declining spending forced both district and charter leaders to seek efficiency. The state passed a law forbidding schools from making reduction in force decisions exclusively on length of service- this was very wise. Ineffective/expensive workers should be the first to go in a reduction in force- the alternative being to RIF a much larger number of young employees regardless of their effectiveness. Federal stimulus and a temporary sales tax increase delayed the need for these adjustments-but only temporarily. During this period Arizona lawmakers began grading schools A-F, and the combination of (mostly) recession related slow population growth and expanded competition halted what had been a non-stop process of student population growth for districts. Charters continue to gain market share against districts- and now both a more rigorous state test and NAEP show a substantial academic advantage for charter students.
None of this is easy for district leaders. It’s not exactly the cold howling wind of market competition, but it is a much higher level of competition and transparency than that to which the K-12 folks feel accustomed. Their world has become less stable and more competitive-Harder to use Barone’s phrase. To their credit, many district leaders have embraced the challenge.
It’s very difficult. It’s also very good for children.
So nationally 8th grade math scores declined by three points. That’s not good but on a 500 scale point test it isn’t clear that it is anything to get too excited about, although it interrupted a long-term positive trend. Florida’s 8th grade math scores however declined by six points. That’s more worrisome.
So digging around in the data reveals that Florida charter schools were unaffected by the swoon- their 8th grade math scores were flat between 2013 and 2015- and delightfully high to boot (see chart).
The Trial Urban District Assessment has information for Miami-Dade and Hillsborough County (Tampa area). Here’s where the mystery deepens- Miami was also unaffected with flat scores between 2013 and 2015. Hillsborough however:
8 point drop in the Tampa area according to TUDA. If there is any rhyme or reason to this I can’t discern it. Some of the national meta-explanations I have seen bandied about don’t seem to work to explain trends in Florida. For instance some have pointed the finger at Obama’s state waivers. There may or may not be something to that nationally, but Florida schools all operated under the same waiver. Standards/testing transition issues likewise impacted all schools-is there some reason why Miami and charter schools should brush this off while the state as a whole did not? Something peculiar may have happened in Hillsborough but Tampa is not big enough to do a huge amount of damage to Florida’s statewide average.
I’m stumped, but always happy to employ the wisdom of the crowd. If you have bright ideas or wild speculation to offer, that’s what the Jayblog comment section was made for!
So we may be able to rule out the weird sample theory since NAEP has different random student samples for each test. On 8th grade math AZ charter school students scored in a statistical dead heat with Massachusetts. While there certainly is a self-selection factor in terms of parents applying for charter schools, I can tell you that every way I found to break the above numbers down shows a charter school advantage- charters scored better among low-income kids, and among middle/high income kids. They scored higher among Anglo kids and among Hispanic kids. Because charter school students only make up 17% of the student body, the NAEP data can only go so far in slicing and dicing data.
The point isn’t that self-selection had nothing to do with these results-they obviously did although we have a growing mountain of random assignment data from around the country that shows admission lottery winners outperform lottery losers. The most important points- first tens of thousands of Arizona parents sit on the outside looking in at charter school spots. Second- both district and charter results have improved in Arizona through a very difficult period of funding cuts for both sectors.
Congratulations to all of Arizona’s long suffering educators and leaders. We’re not there yet, but we are on our way.
Previously I had shown that if you compare general education low-income students, that Arizona charter schools made very large academic gains on the 2015 NAEP. This morning I woke up and thought: what if we compared Arizona charter school students to other statewide averages as a whole? Arizona has the highest percentage of students attending charter schools of any state. There are more students attending Arizona charter schools than Wyoming public schools after all, so why not?
I ran the numbers for 8th grade reading. Here are the results:
Well how about that? Now before you start babbling conspiracy theories about student demographics let me remind you of a few things. First of all, those states up at the top are all very pale complected, host Ivy League universities and have average family incomes in the six figures. Arizona meanwhile is a relatively poor state with a plurality of Hispanic students and a law which requires random assignment lotteries to charter schools. I don’t have statistics for the percentage of Hispanic students in Arizona charter schools but having visited many of them I can assure you that it will beat the living daylights out of the same figure for New Hampshire. In other words if you want to wildly speculate about student demographics you can lick the strings of Angus’ electric guitar while he has it plugged in to his portable nuclear generator necessary to burst your ear drums and make you love it.
Did I forget to mention that Massachusetts probably spends more than twice the amount per pupil when compared to Arizona charter schools? No? Ok well that too.
Well, maybe the 8th grade reading sample just happened to over-sample the highest performing charters in 2015. Could be-so let’s check the 4th grade reading numbers:
So it’s not much of a mystery to see why tens of thousands of Arizona parents sit unhappily on charter school waiting lists- the gap in scores between AZ charter schools and the AZ average is considerable. This is not to say that every Arizona charter school is fantastic (they aren’t) or that every AZ district school is low performing (this is not the case). Moreover Arizona district schools have been improving while dealing while a great deal of adversity since 2007 and in the end this is absolutely crucial. Key to that progress however is a growing little New England scoring school system out here in our delightful patch of cactus.
Arizona Governor Doug Ducey campaigned on funding the wait list- getting more resources out to district and charter schools with long wait lists to get more of them in the door and off the list. I hope the above charts indicate just what a profoundly wonderful idea that would be, so…
All states started taking NAEP in 2003. Some jurisdictions (**cough** DC **cough** Florida) scored big gains before 2003, but hey they are near the top anyway. DC is your winner, more to follow.


 Posted by matthewladner