I Bless the Schools Down in Michigan

May 2, 2018

(Guest Post by Matthew Ladner)

Neerav Kingsland has written a response to posts by Jay and yours truly on Louisiana charters generally and the Recovery School District specifically. I will begin by confessing a sin- Neerav is correct that I go a bit over the top at times. The “Prime Directive” of JPGB has always been first and foremost for the authors to entertain ourselves. We do occasionally take ideas seriously, but we try to keep things light around here, which often involves reasoning by pop-culture analogy. Maybe some gratuitous use of an animated gif here or there, or an occasional musical interlude. All in moderation of course…

Like Leo Moracchioli we try not to take ourselves too seriously, but one idea that I do take very seriously is the one quoted in the original post from Jonathan Haidt, which merits repetition:

In the same way, each individual reasoner is really good at one thing: finding evidence to support the position that he or she already holds, usually for intuitive reasons. We should not expect individuals to produce good, open-minded, truth-seeking reasoning, particularly when self-interest or reputational concerns are in play. 

But if you put individuals together in the right way, such that some individuals can use their reasoning powers to disconfirm the claims of others, and all individuals feel some common bond or shared fate that allows them to interact civilly, you can create a group that ends up producing good reasoning as an emergent property of the social system. This is why it is so important to have intellectual and ideological diversity within any group or institution whose goal is to find truth (such as an intelligence agency or community of scientists) or to produce good public policy (such as a legislature or an advisory board).

I do not wish to allow even the JPGB Prime Directive to interfere in this. I appreciate that David Osborne offered some comments, and that Neerav also took the time to respond in a civil fashion. I offer an apology if my bombast lacked civility as it must not interfere in the free exchange of evidence and ideas.

On the substance, I’ll offer the following comments in the spirit of the Haidt quote:

My preexisting bias before the release of the 2017 NAEP was that the Louisiana RSD was a clever policy innovation given the circumstances of post-Katrina New Orleans, but that the concept employed enormous amounts of financial and human capital. Perhaps too much of both to be of general interest.

David Osborne noted in a comment that only 43% of Louisiana charters are New Orleans RSD charters, which is a fair point to make. This however is about 43% more than the typical state, and a portion of the rest Louisiana’s charters are RSD charters operating outside New Orleans. Osborne noted in a comment that those charters aren’t going so well. In my preexisting frame, I interpret this as RSD not being able to make the trip down the Atchafalaya Bridge from New Orleans to Baton Rouge, much less to other states. This seems like confirmatory evidence to me, but maybe not. If not, why not?

NAEP data is still indeed inexact on this point, but state testing data for New Orleans specifically has also been in decline. NAEP shows large statewide declines in charter scores since 2013, and the state’s own testing data pointing in the same direction specifically for New Orleans. 

What sort of evidence would lead a reasonable person to conclude that the RSD model is very difficult to replicate and to sustain?  We all have theories of change, but is this one falsifiable? I believe that the combination of statewide NAEP scores and the decline of state test scores in New Orleans is an issue. I’m in favor of RSD continuing in New Orleans, but nothing about the evidence produced last few years is giving me the itch to replicate it in my home town.

Speaking of Phoenix, Neerav (correctly) noted a Credo multivariate study showing meh charter results in Arizona. Harvard’s Marty West found similar results, but both Credo and West used data that ended in 2012. I won’t go into the details here but I believe Credo, West, recent NAEP and recent AZMerit can all be correct. The 2012 Philadelphia Eagles went 4-12 but they won the Superbowl last season. Between lots of openings, closings, and schools maturing past their training wheels stage, AZ charters turned over their roster like a pro-sports team.

RSD advocates have a theory of change largely based upon increased state test scores in New Orleans. The more recent state data and NAEP however both seem to be signalling a warning sign. If this is just my preconceived notions getting the better of me, please help me out. Nevermind Arizona, based on anything and everything we can gather from Credo, NAEP, recent state scores and even random assignment studies, why should Louisiana charter policies be touted in preference to Michigan’s based upon the available results?


The Origin of Arizona’s Nation Leading NAEP gains

May 1, 2017

(Guest Post by Matthew Ladner)

It’s been interesting for me to watch different columnists at the Arizona Republic react differently to the news that Arizona is the only state that has been the only state with statistically significant gains on all six NAEP exams. Bob Robb stated in a recent column that he supports choice but thinks it is limited strategy for improving outcomes. His colleague Joanna Allhands noted the fact that Arizona has lead the nation in NAEP gains, but said we have no idea of why that was the case.

I hope the above chart explains why I think even Robb is selling choice short, why Allhands should reconsider K-12 agnosticism. Formally Allhands is correct that we do not know why Arizona has been leading the nation in gains, but I hope a close examination of the above chart will be fairly persuasive that Arizona’s choice policies had a great deal to do with it.

So let’s peel the above chart like an onion. The first layer- blue columns- are the national public school gains across all six NAEP subjects (4th and 8th grade Math, Reading and Science). These are across time gains rather than cohort gains, calculated by subtracting the 2009 NAEP score from the 2015 score. Looking at the blue columns shows that the national progress falls into the strictly meh: 1 point on 4th grade math, -1 point on 8th grade math, one point on 4th grade reading, 2 points on 8th grade reading, four points on 4th and 8th grade science. Nothing much to celebrate nationally.

Next look at the yellow columns- these are the 2009 to 2015 gains for Arizona school districts (no charters). As you can see, these gains are consistently larger than the blue national public numbers, especially in math and science.

Third, look at the total statewide gains (Arizona flag columns). These are the gains for the combined district and charter schools between 2009 and 2015. As you can see, these gains are consistently larger than the district gains alone (yellow columns) and far, far larger than the national public averages (blue columns). Arizona was the only state to have statistically significant gains on all six NAEP exams between 2009 and 2015.

Finally, in the back in red tower the gains for Arizona charter schools between 2009 and 2015. The over/under for percentage of Arizona students attending charters in 2015 was around 15%, so although these gains are huge, they directly move the statewide needle by the differences between the yellow district columns and the flag columns. *See boring stat nerd note below.

The above gains represent the 2015 minus the 2009 scores-for example Arizona’s 8th grade math score minus Arizona’s 2009 8th grade math scores. A different method for calculating NAEP gains is to follow the progress of a single cohort of students across time. The NAEP math and reading tests have been timed and scaled to allow such comparisons- 4th graders took for instance the 4th grade NAEP math in 2011 and the NAEP 8th grade math exam in 2015. So…which state’s students learned the most about math between their 4th grade test in 2011 and and the 8th grade test in 2015?

Nationally American students gained 41 points between the 2011 4th grade exam and the 2015 8th grade exam-so nationally about 10 points per year. Arizona lead the nation with a 48 point gain. So how did Arizona charter schools fare in this comparison? **See second nerdy statistical note.

Note that the gap between Arizona charters and districts in cohort gains (12 points) is almost as large as the gap between gain leading Arizona and the lowest rated state (Alabama). So what does this mean in practical terms? The faster rate of improvement meant that Arizona charter school students got to do this on the 2015 NAEP, which is pretty cool if you like majority-minority schooling sectors that show globally competitive levels of academic achievement:

Finally, we have a rich set of empirical studies that suggest that parental choice leads to academic gains in traditional district school systems. Going back to the first slide, we have reason to suspect that some of the differences between the yellow and the blue columns relates to parental choice. If you suspect that budget cuts lead to academic gains (I don’t) then okay maybe, or if you can come up with a reason why new standards would have a very unusually large positive impact in Arizona when they flopped around the country, I’m willing to entertain a story to that effect, but it sounds like an implausibly complicated story.

On the choice side, round about 2007, the economy collapsed in a way that made a lot of property available, and Arizona’s charter sector put the peddle to the metal. Arizona charter school sector rose by a rousing 43,000 students in 2013 for example. The number of students exercising private choice also increased during this period, and statewide enrollment growth slowed, but that increase pales next to that of Arizona charters, which increased from 95,000ish students in 2008-09 to 188,000ish students in 2013-14.

We can feel confident that some of the difference between the statewide numbers and the blue columns relates to parental choice. We can feel very confident indeed that some of the difference between the red columns and the blue columns is related to parental choice. I’m open to other interpretations-and the comment section is open-but Occam’s Razor leads me to believe that a huge increase in the prevalence of parental choice that occurred during the Great Recession lead to direct benefits (high charter school scores) and powerful competitive effects (attract students or suffer real consequences- real accountability as opposed to the phony slap on the hand sort).

*The 2009 NAEP Arizona charter school estimates had large standard errors of estimates, owing to the considerably smaller size of the sector at the time. Unless Arizona charter school sleeper agents have infiltrated the NAEP there is little reason to suspect that random error will consistently advantage charter schools across six NAEP exams. Random error in both the 2015 and 2009 estimates means that the red columns in the first chart could be either smaller or bigger if we had actually tested everyone, but I’m at a loss for a reason to think of a reason why the errors across twelve different testing samples (six in 2009 and another six in 2015) would consistently line up to produce a mirage of Arizona charter school academic conquest, again absent sleeper agent infiltration.

** Standard error plays into the calculation of cohort gains as well on both ends of the calculation (in this case 2011 and 2015 scores) such that either could have been higher or lower if we had tested the entire population. Standard errors are larger for sub-population estimates than statewide averages, but again could play either way. For example if the population score for 2011 charter school students was higher than the NAEP estimate, the cohort gain will be overestimated, and if the true population score in 2011 was actually lower, then the cohort gain reported here would be an underestimate. All NAEP scores are estimates based on samples. Arizona’s charter school students displayed larger than any state cohort gains than any other state in both math and reading, but we cannot have the same level of confidence in these estimates as in statewide averages. Again, assuming random error and a lack of Arizona charter school sleeper agents in NAEP, we would not expect random error to consistently advantage Arizona charter schools.

Finally, the state’s AZ Merit exam also shows large advantages for Arizona charter school students vis a vis district students. Sampling is not an issue in AZ Merit, and these results lend reinforcement to the NAEP results. Unless…AZ charter school sleeper agents infiltrated the state’s testing system as well…


A Society that Puts Freedom before Equality will get a high degree of both

April 20, 2017

(Guest Post by Matthew Ladner)

Want proof- here is how “9/33” charter sectors did on the 2015 NAEP 8th grade math test. First let’s look at middle and high income kids in Arizona and Colorado charters compared to the statewide averages for middle and high income kids:

Whew- would you look at that? I wonder if those AZ and CO charter school kids are getting half the funding per pupil of Massachusetts or not. Yes, right, so back on track here, those above kids are all middle and high-income, so how did low-income students far in these awful, horrible, no-good Wild West anarchist charter schools perform? I’m glad you asked:


Remarks to the Arizona Chamber of Commerce: More Than This

June 20, 2016

Friedman award

(Guest Post by Matthew Ladner)

The Arizona Chamber of Commerce and Industry held an awards breakfast last Friday, where they recognized a number of worthy recipients including friends serving in the legislature like Senator Debbie Lesko and Senator Steve Pierce and Representative Paul Boyer.  They also however chose to recognize a rather dubious character with whom you will be all too familiar by bestowing upon him the Milton Friedman Award, Obviously I was deeply touched to receive an award named after one of my heroes.

At the request of the Chamber, I prepared the following remarks:

I am deeply touched to receive this honor, but I must say that I feel a bit like Jack Ryan. You may recall the scene in the Hunt for Red October when Ryan exclaims “Me?!? I’m just an analyst!”

Arizona is sailing into history!

While I am deeply appreciative of the award, it is I should honor you. The groundwork for what I am about to describe was already in place when I arrived in Arizona in 2003. You as long-time business and civic leaders in Arizona should take great pride in what I will relate.

It was recently reported that Arizona ranks number two in job growth. I am happy to relate to you that Arizona ranks number one in K-12 academic gains.  The National Assessment of Educational Progress gives academic exams to 4th and 8th graders in all 50 states every two years. When you follow the academic progress of 4th graders in 2011 to when they became 8th graders in 2015, you find that Arizona students made more progress than any other state. Given everything this state endured during the Great Recession, this is a remarkable tribute to the resiliency of our students, educators and policymakers.

NAEP Math cohort gains with AZ charters

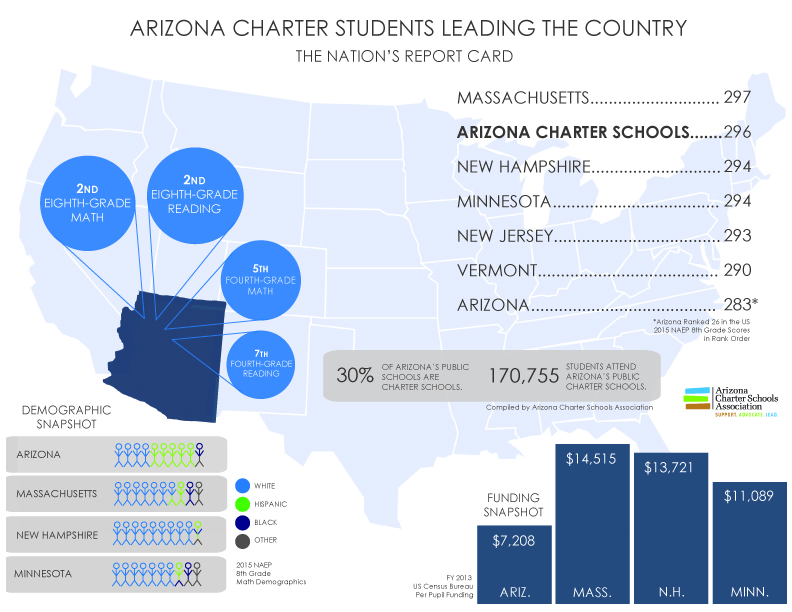
This progress is across the board and includes both district and charter schools. In addition our charter school students did something truly extraordinary. On the same 2015 National Assessment of Educational Progress, Arizona’s charter school students scored comparably to the highest performing states like Massachusetts and New Hampshire. This is all the more impressive when you consider that Arizona charter schools are funded far more modestly, and have student bodies far more diverse, than the schools in New England.

These results are remarkable. How did this happen? What is the secret sauce? There is no single explanation and there are many ingredients in the Arizona K-12 reform gumbo. You made the mistake however of giving me an award named after the great Milton Friedman and then the even larger mistake of giving me the microphone, so I am going to talk about parental choice. It seems clear to me that parental choice has been a major contributor to Arizona’s improvement.

Parental choice is controversial. Some people believe that parental choice is about some schools being “good” while others are “bad.” Those who believe this however are mistaken. Parental choice is about the fact that every single child deserves to have access to a school that is a good fit for them. Good fits between students and schools are very powerful, and we cannot replace it with any other source of improvement.  Without giving parents the ability to match the needs and interests of their child with the particular strengths of a school, the public education system will never reach full potential.

During the campaign, Governor Ducey quite rightly placed an emphasis on Arizona students sitting on wait lists at our high demand district and charter schools of choice. These students only have one shot at their K-12 education, but they find themselves stranded by the inadequacies of our policies, waiting for the opportunity to attend their good fit school. Meanwhile the sand continues to run through their hourglass. 

Our challenge includes this, but it is also more than this.

Tens of thousands of Arizona students sit on wait lists, but hundreds of thousands of Arizona parents never even considered some of our highest performing district and/or private schools. These schools may have been great fits for the needs of their children, but they didn’t even cross the radar screens of these parents for consideration. Why not? Because they have effectively been priced out of consideration. Parents either cannot afford the high price of real estate for the district schools, or else cannot afford to pay tuition in addition to their taxes. Many sadly see these schools as being for someone else, but not for them. It doesn’t however have to remain this way. We have it in our power to make our educational opportunities more inclusive. The blessings of liberty should not remain the privilege of the few, but rather the birthright of all.

I fell in love with Arizona because of our innovative spirit and I believe that we have been richly rewarded for it. If Dr. Friedman were still with us, I believe he would be proud of what we have done, and would encourage us to do more. Arizona is a state with big horizons, where the sky is the limit. May we always remain so.

I genuinely am deeply appreciative of both the award, and the opportunity to work with great people on these issues in Arizona.


AZ Charters and the NAEP

January 8, 2016

(Guest Post by Matthew Ladner)

My friends at the Arizona Charter School Association put together this rocking graphic on Cactus Patch charter students RAWKING the 2015 NAEP. Make sure to check out the two mini-graphs at the bottom showing just how much more diverse AZ charters are than the states in their neighborhood of scores and how how the per pupil funding stacks up. Stare at them long and hard, and think about the times you’ve heard people say things like the following. Maybe you said them yourself:

Oh but it’s the Wild West out here. Oh they really should not have let so many charter schools open, they should be more cautious about authorizing like right thinking people back East. Tut-tut, KIPP won’t open a school there at that funding level.

Line forms to the left to either update your flawed thinking and/or offer your heartfelt apology. There’s still room on the bandwagon for those who follow the evidence where it leads.


Arizona Gains and the Orbit of Mercury-Wrecking Balls for Flawed Paradigms

December 21, 2015

(Guest Post by Matthew Ladner)

Recently I made an off-hand comment about Arizona NAEP gains being like the problem with the orbit of Mercury. I decided that it would profit from some further explanation. Newtonian mechanics seemed to have everything figured out, with that nagging problem of the orbit of Mercury doing something it shouldn’t. The “problem” with the orbit of Mercury of course wasn’t really a problem at all. It turned out to be a problem with our incomplete understanding of how the universe works- as illustrated in the above video.

Arizona 8m NAEP

So just how do Arizona NAEP scores resemble the orbit of Mercury? The 2015 NAEP shows that Arizona charter school students scoring in the range of New England states. Arizona charter schools serve a majority minority student population and spend only $8,041 per student- about a thousand less per student than Arizona districts and far less than the average spending in New England states.

AZ charter vs. district

Arizona’s AZ Merit exam demonstrated even larger gaps between charter and district scores than the NAEP, providing external validation for the NAEP scores.

Moreover Arizona charters, like districts, have been operating in a very tough environment. Back in my Goldwater Institute days, I would go to the Joint Legislative Budget Committee website as a rich source of for refuting complaints about public school spending. As it happened, the districts were getting more students, and the spending per pupil was climbing. Cry me a river. The Great Recession however clobbered the housing dependent Arizona economy and the same document now shows that the Great Recession shot Arizona school funding in the arm, punched the gunshot wound, and then threw us out through the front windshield.

Look at those guys! Their NAEP scores are going to collapse!

A little before the release of the 2015 NAEP, Mike Petrilli offered a friendly bet of a beer to me and Lisa Graham Keegan that Arizona’s NAEP scores would go down between 2013 and 2015 based on economic difficulties. We both instinctively thought they would go up, and they did. We are thirsty Mike! Taking a longer term view of the entire Great Recession period however proves more revealing.

AZ Mercury 1

Arizona scores have improved at six times the national rate on 4th grade math, 7 times the national rate on 8th grade math, five times the rate on 4th grade reading and 2.67 times the rate on 8th grade reading. How did a state that saw a decline in inflation adjusted spending per pupil drop from $9,438 in 2007 to $7,828 in 2014 (see JLBC doc link above) manage to outpace the nation in progress by such a wide margin? District interests here have a non-stop mantra about Arizona’s relevantly low ranking in per pupils funding but, er, why are we outpacing the nation by such a wide margin even as our funding declines?

Whoa- that’s unpossible!

Something is wrong here- but it is not Arizona’s positive score trends. What is wrong is some very common assumptions about K-12. I’ll get to that below.

The reality of Arizona K-12 improvement is of course complicated and defies any single explanation, with big changes going on at the same time. One factor that obviously contributed and that we can quantify charter schools. The next figure shows the NAEP gains by subject/grade for Arizona students for districts and charters (2015 scores minus 2007 scores).

Arizona Mercury 2

Some may attempt to dismiss the difference between charters and districts as a product of differences in student populations. Only a random assignment study could definitively test this assumption, but a large amount of evidence suggests which way such a (sadly non-existent) study would fall. Arizona charter students rank well when compared to statewide averages when compared to a wide variety of subgroups (general ed, White, Hispanic, etc.) While differences in student populations could explain some of the differences between Arizona charters and Arizona districts, they can’t be put to similar use in explaining why Arizona students outscore similar students in New Hampshire. Arizona law also require random lottery admissions, serve a majority-minority student population and the improvement we see in the district scores does not exactly sit comfortably with a massive brain drain to charters story. If all of Arizona’s brightest students were fleeing to charters, it would put a substantial drag on district scores. Instead we see district scores improving.

Arizona has a higher percentage of students attending charters than any other states, but that still only falls in the teens– 13.9% in 2012-13. Even so these gains are large enough to make a noticeable difference the aggregates:

Arizona Mercury 3

The differences in the above charts only display direct impact of charter school scores the statewide average. We have substantial reason to believe however that the growth of charter schools has indirectly raised Arizona scores as well through competition. In other words, charter schools almost certainly deserve some of the credit for the blue columns in the above chart rather than merely the difference between the red and the blue.

The reason I was willing to take Mike’s friendly bet on 2015 NAEP scores- I believe that by far the greatest opportunity to improve K-12 lies in making more efficient use of existing resources. In the opening pages of his 2004 book Hard America Soft America: Competition vs. Coddling and the Battle for the Nation’s Future the astute observer Michael Barone noted the following:

Public schools for example may be the most notable example of a predominantly Soft institution-which helps explain why American children are confined mostly to Soft America. But as we will see, our schools have not always been so Soft; they have contained corners of Hardness, and there are signs they are getting Harder now.

“Coddling” is not a term one would use to describe Arizona public education during the 2007-2015 period. Declining spending forced both district and charter leaders to seek efficiency. The state passed a law forbidding schools from making reduction in force decisions exclusively on length of service- this was very wise. Ineffective/expensive workers should be the first to go in a reduction in force- the alternative being to RIF a much larger number of young employees regardless of their effectiveness. Federal stimulus and a temporary sales tax increase delayed the need for these adjustments-but only temporarily. During this period Arizona lawmakers began grading schools A-F, and the combination of (mostly) recession related slow population growth and expanded competition halted what had been a non-stop process of student population growth for districts. Charters continue to gain market share against districts- and now both a more rigorous state test and NAEP show a substantial academic advantage for charter students.

None of this is easy for district leaders. It’s not exactly the cold howling wind of market competition, but it is a much higher level of competition and transparency than that to which the K-12 folks feel accustomed. Their world has become less stable and more competitive-Harder to use Barone’s phrase. To their credit, many district leaders have embraced the challenge.

It’s very difficult. It’s also very good for children. 


FL Hispanic Students Attending Charters Do Math like Connecticut, AZ Hispanic Charter Students like Delaware

November 23, 2015

FLAZ 8m

(Guest Post by Matthew Ladner)

Hispanic students attending charter schools in Florida and Arizona both scored about a grade level ahead of Hispanic students attending district schools. Figure 1 shows where this lands them in terms of statewide averages for all students. Notice that Hispanic students attending charter schools in Florida are almost a grade level ahead of the statewide average for all students in Florida.

Nationwide all students in public schools scored 281 on 8th grade math in 2015. This means that AZ and FL Hispanic students ended in a statistical dead head with the average.  Hispanic students in charter schools have gained 20 points in Arizona and 19 points in Florida over the 2005 averages. This reflects several things- including a lot of hard work by the students and teachers- but also perhaps maturing charter sectors with startups full of kids just transferring into the startup school impacting scores less than in the past.


Slice and Dice the Data but Arizona Charters Continue to CeleNAEP Good Times

November 16, 2015

(Guest Post by Matthew Ladner)

So I’ve still been digging into the AZ NAEP data. When something seems too good to be true, it is best to assume it isn’t true. I decided to investigate the possibility that something goofy was going on with the free and reduced lunch variable. Not all  Arizona charters choose not to participate in the program, and the eligibility criteria for the program has changed over time.

Parental education may be a good stand-in for what may be a suspect income variable. At the 8th grade level, the NAEP data slicer has an a variable for parental education. The below figure presents the 8th grade math scores for students with college graduate parents. In order to account for possible differences in special program participation, the figure is only for general education students with college graduate parents (the ranking results don’t change much if you look at all students). I will again stress that these comparisons do not substitute for a proper random assignment study-only that they tell us more than an examination of aggregate scores for all students.

NAEP AZ charter 8m parent educ

Watch out New England…Arizona charter schools are coming to get you!

For you incurable skeptics, the below figure presents the same comparison using 8th grade reading, and bear in mind that each NAEP test involves a different sample of students.

NAEP AZ charter 8r parent educ

We can also look at these numbers by race/ethnicity. NAEP provides subset numbers for Anglos and Hispanics attending charter schools in Arizona. Here is the NAEP 8th grade reading test for Hispanic students:

AZ Charter 8r Hispanic

And here it is for Anglo students:

AZ Charter 2015 NAEP 8r Anglo

Okay but what if those Arizona charter schools are chock full of Anglo kids whose parents graduated college? Now the National Alliance of Public Charter Schools reports that Arizona charter schools have a majority-minority student body, so this is not the case- but what if a large portion of the Anglo kids attending charter schools have parents with college degrees? Ok, well, let’s compare Anglo kids whose parents graduated from college:

AZ Charter 2015 NAEP 8r Anglo college

Did I mention the part where Arizona charter schools did this with $8,041 per kid in public funding? Better results at a lower cost is what America is going to need very soon- and well here it is. Massachusetts NAEP scores taste like chicken btw, only gamier, could use a little salt.


The Wild West is Best put your NAEP scores to the Test

November 6, 2015

(Guest Post by Matthew Ladner)

I’m going to use my Professor X powers to read your mind…you are thinking “Alright Ladner enough with the Arizona NAEP scores- won’t you give it a rest?”

No I will not. There’s a party going on right here-it’s a celeNAEPtion and it lasts throughout the year.

I’ve anticipated some of the possible objections to celebrating Arizona NAEP scores. Maybe those dastardly charter schools may have been circumventing their random assignment admission lottery legal requirements to load up on rich white kids! Maybe they don’t have many English Language Learners, special education students, Hispanic students, etc. District schools have to take everyone who can afford to buy a home in their attendance zone so comparisons aren’t fair…

Well some find this a very useful story, but we can actually examine it in the data. Let me note from the outset that variations in student demographics and special program status do exist between schools and school systems, achievement gaps between such student groups are a well-established phenomenon and that some accounting for such differences should be (carefully) made if our goal is to judge the effectiveness of a system. The best way to test this sort of thing is with a well done random-assignment study, but sadly we don’t have one.

I reported earlier that Arizona charter schools essentially tied Massachusetts (the highest scoring state) and the private school national average scores on the NAEP 8th grade reading test in 2015. What happens if we only look at the scores of general education students whose family income make them eligible for a free or reduced lunch? If those dastardly charter schools have been carefully avoiding special needs and ELL students it isn’t going to help them with this comparison.

AZ Charter 8m ranking

Let’s just put it on the table that free and reduced lunch eligible is going to translate to a higher proportion of Hispanic students in Arizona charter schools, but that was not a problem hombre. Do you notice anything similar about all those states (slightly) ahead of Arizona charter schools? Let me give you a hint…

Oh and…


CeleNAEP Good Times-C’MON!

November 5, 2015

(Guest Post by Matthew Ladner)

My #Shadowfaction partner in crime Lisa Graham Keegan and I hit the pages of the Arizona Republic to celeNAEP good times in Arizona. Teaser trailer:

NAEP has given 40 exams on mathematics and reading to representative samples of Arizona students in various years since the early 1990s. As a low-income state with more than its share of student challenges (high poverty and non-native English speaking rates), Arizona has never met or exceeded the national average score – until now.

Arizona’s eighth-graders edged out the national average in mathematics and only narrowly missed doing the same in reading. Therefore, Arizona’s Class of 2019 carries a special distinction in state history – one that future classes can both match and exceed. Achievement has improved substantially since the last pre-recession measures in 2007.

Of notable attention are Arizona’s charter-school students, who matched the scores for the highest-scoring states on the 2015 NAEP. On eighth grade mathematics, for instance, Arizona charter students scored in a statistical dead heat with Massachusetts, the highest scoring of the 50 states.