(Guest Post by Matthew Ladner)
It’s been interesting for me to watch different columnists at the Arizona Republic react differently to the news that Arizona is the only state that has been the only state with statistically significant gains on all six NAEP exams. Bob Robb stated in a recent column that he supports choice but thinks it is limited strategy for improving outcomes. His colleague Joanna Allhands noted the fact that Arizona has lead the nation in NAEP gains, but said we have no idea of why that was the case.
I hope the above chart explains why I think even Robb is selling choice short, why Allhands should reconsider K-12 agnosticism. Formally Allhands is correct that we do not know why Arizona has been leading the nation in gains, but I hope a close examination of the above chart will be fairly persuasive that Arizona’s choice policies had a great deal to do with it.
So let’s peel the above chart like an onion. The first layer- blue columns- are the national public school gains across all six NAEP subjects (4th and 8th grade Math, Reading and Science). These are across time gains rather than cohort gains, calculated by subtracting the 2009 NAEP score from the 2015 score. Looking at the blue columns shows that the national progress falls into the strictly meh: 1 point on 4th grade math, -1 point on 8th grade math, one point on 4th grade reading, 2 points on 8th grade reading, four points on 4th and 8th grade science. Nothing much to celebrate nationally.
Next look at the yellow columns- these are the 2009 to 2015 gains for Arizona school districts (no charters). As you can see, these gains are consistently larger than the blue national public numbers, especially in math and science.
Third, look at the total statewide gains (Arizona flag columns). These are the gains for the combined district and charter schools between 2009 and 2015. As you can see, these gains are consistently larger than the district gains alone (yellow columns) and far, far larger than the national public averages (blue columns). Arizona was the only state to have statistically significant gains on all six NAEP exams between 2009 and 2015.
Finally, in the back in red tower the gains for Arizona charter schools between 2009 and 2015. The over/under for percentage of Arizona students attending charters in 2015 was around 15%, so although these gains are huge, they directly move the statewide needle by the differences between the yellow district columns and the flag columns. *See boring stat nerd note below.
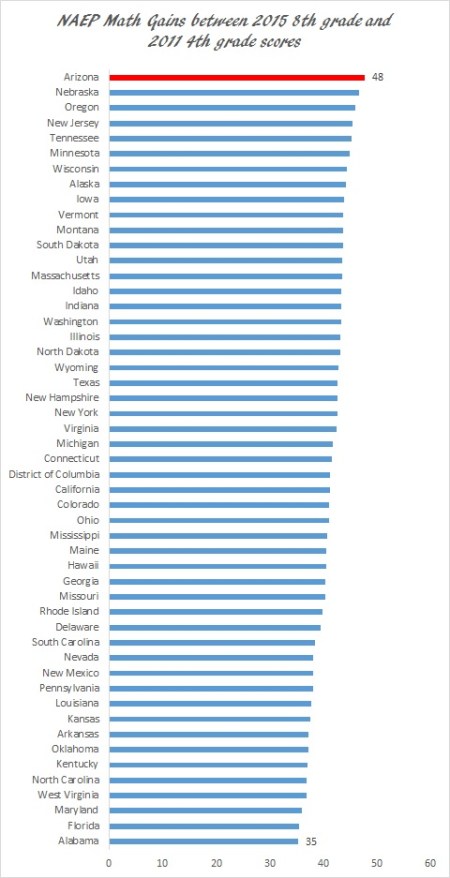
The above gains represent the 2015 minus the 2009 scores-for example Arizona’s 8th grade math score minus Arizona’s 2009 8th grade math scores. A different method for calculating NAEP gains is to follow the progress of a single cohort of students across time. The NAEP math and reading tests have been timed and scaled to allow such comparisons- 4th graders took for instance the 4th grade NAEP math in 2011 and the NAEP 8th grade math exam in 2015. So…which state’s students learned the most about math between their 4th grade test in 2011 and and the 8th grade test in 2015?

Nationally American students gained 41 points between the 2011 4th grade exam and the 2015 8th grade exam-so nationally about 10 points per year. Arizona lead the nation with a 48 point gain. So how did Arizona charter schools fare in this comparison? **See second nerdy statistical note.

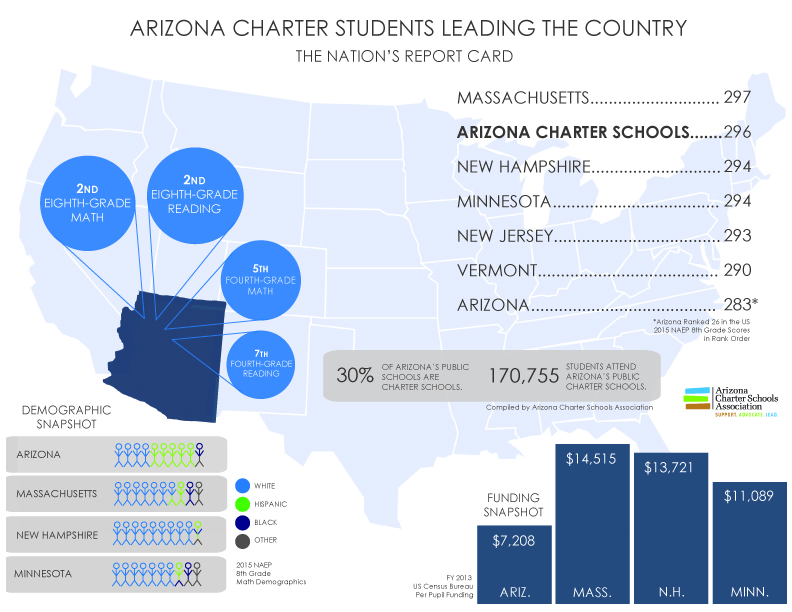
Note that the gap between Arizona charters and districts in cohort gains (12 points) is almost as large as the gap between gain leading Arizona and the lowest rated state (Alabama). So what does this mean in practical terms? The faster rate of improvement meant that Arizona charter school students got to do this on the 2015 NAEP, which is pretty cool if you like majority-minority schooling sectors that show globally competitive levels of academic achievement:
Finally, we have a rich set of empirical studies that suggest that parental choice leads to academic gains in traditional district school systems. Going back to the first slide, we have reason to suspect that some of the differences between the yellow and the blue columns relates to parental choice. If you suspect that budget cuts lead to academic gains (I don’t) then okay maybe, or if you can come up with a reason why new standards would have a very unusually large positive impact in Arizona when they flopped around the country, I’m willing to entertain a story to that effect, but it sounds like an implausibly complicated story.
On the choice side, round about 2007, the economy collapsed in a way that made a lot of property available, and Arizona’s charter sector put the peddle to the metal. Arizona charter school sector rose by a rousing 43,000 students in 2013 for example. The number of students exercising private choice also increased during this period, and statewide enrollment growth slowed, but that increase pales next to that of Arizona charters, which increased from 95,000ish students in 2008-09 to 188,000ish students in 2013-14.
We can feel confident that some of the difference between the statewide numbers and the blue columns relates to parental choice. We can feel very confident indeed that some of the difference between the red columns and the blue columns is related to parental choice. I’m open to other interpretations-and the comment section is open-but Occam’s Razor leads me to believe that a huge increase in the prevalence of parental choice that occurred during the Great Recession lead to direct benefits (high charter school scores) and powerful competitive effects (attract students or suffer real consequences- real accountability as opposed to the phony slap on the hand sort).
*The 2009 NAEP Arizona charter school estimates had large standard errors of estimates, owing to the considerably smaller size of the sector at the time. Unless Arizona charter school sleeper agents have infiltrated the NAEP there is little reason to suspect that random error will consistently advantage charter schools across six NAEP exams. Random error in both the 2015 and 2009 estimates means that the red columns in the first chart could be either smaller or bigger if we had actually tested everyone, but I’m at a loss for a reason to think of a reason why the errors across twelve different testing samples (six in 2009 and another six in 2015) would consistently line up to produce a mirage of Arizona charter school academic conquest, again absent sleeper agent infiltration.
** Standard error plays into the calculation of cohort gains as well on both ends of the calculation (in this case 2011 and 2015 scores) such that either could have been higher or lower if we had tested the entire population. Standard errors are larger for sub-population estimates than statewide averages, but again could play either way. For example if the population score for 2011 charter school students was higher than the NAEP estimate, the cohort gain will be overestimated, and if the true population score in 2011 was actually lower, then the cohort gain reported here would be an underestimate. All NAEP scores are estimates based on samples. Arizona’s charter school students displayed larger than any state cohort gains than any other state in both math and reading, but we cannot have the same level of confidence in these estimates as in statewide averages. Again, assuming random error and a lack of Arizona charter school sleeper agents in NAEP, we would not expect random error to consistently advantage Arizona charter schools.
Finally, the state’s AZ Merit exam also shows large advantages for Arizona charter school students vis a vis district students. Sampling is not an issue in AZ Merit, and these results lend reinforcement to the NAEP results. Unless…AZ charter school sleeper agents infiltrated the state’s testing system as well…


 Posted by matthewladner