(Guest Post by Matthew Ladner)
Tom Patterson recently wrote a column about Arizona NAEP scores, and stated that Arizona had the highest overall gains in combined Reading and Math scores between the 2015 8th grade scores and the same cohort of students 2011 scores as 4th graders. I decided to check it out.
NAEP has been following an odd number year cycle, meaning that the four-year gap between the same cohort of student can be measured. In this case, I took the statewide 2015 Math scores and subtracted from them the statewide 2011 4th grade math scores. We more commonly compare 8th grade scores to those of previous 8th graders, but measuring cohort gains is also of interest.
A note of caution before proceeding it is possible to do well on the below gains analysis without ranking terribly high. Likewise you could have the highest overall 8th grade scores but also had high 4th grade scores four years earlier and look meh in this particular analysis. Like achievement gaps, each state’s gain score requires a close look before drawing conclusions- but generally speaking the states with the biggest scores below would have started with modest 4th grade scores and then shown much higher scores for the same students as 8th graders. Obviously factors other than school system effectiveness could come into play (massive gentrification in the District of Columbia comes readily to mind) and every state will have students both come and go between 2011 and 2015.
Okay now that you’ve read the warning label:
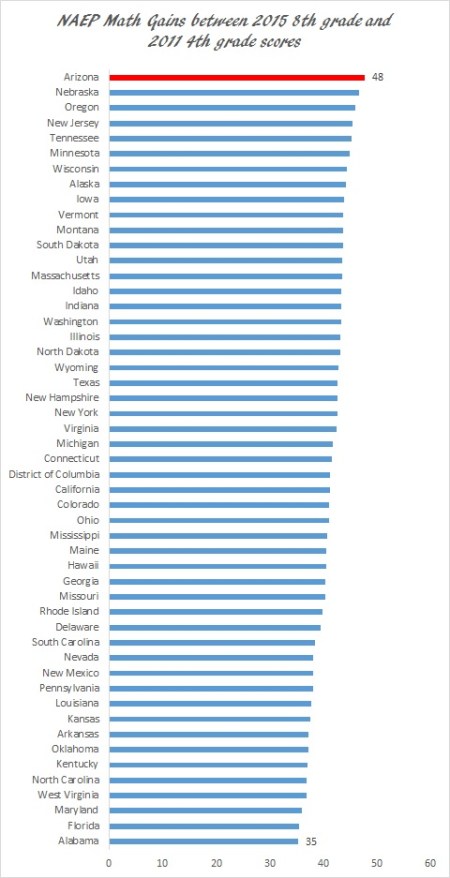
In terms of context, Arizona’s 4th graders scored 5 points below the national average in 4th grade math in 2011 but two points higher in 8th grade math in 2015. There is nothing about starting below the national average that makes it inevitable you will crush the ball in gains. Alabama for instance had 2011 4th grade math scores 9 points below the national average but then displayed 8th grade scores in 2015 that were 14 points below the national average.
Reading gains below:
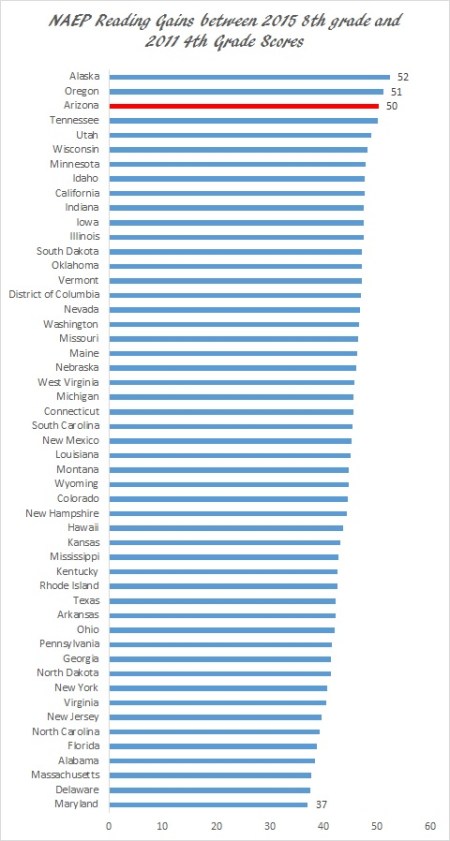
Arizona’s 4th graders scored 8 points below the national average in 4th grade reading in 2011. As 8th graders in 2015 however this group of students had scores only one point below the national average- within the margin of error thus catching them up to the national average. In short, Tom Patterson nailed it- AZ looks to have had the best 2011 to 2015 period.
So this got me to thinking-what if we tracked the same cohort gains for Arizona charter school students and compared them to statewide averages? As we’ve noted before, with the largest state charter sector as a percentage of the population, Arizona has substantially more students than the entire public school system of Wyoming. The National Alliance of Public Charter Schools also compiles data about state charter sectors, so we know that the sector (like Arizona as a whole) has a majority minority student body.
Well this is what it looks like for Math:

Keep on rocking the free world! Similar story with reading:
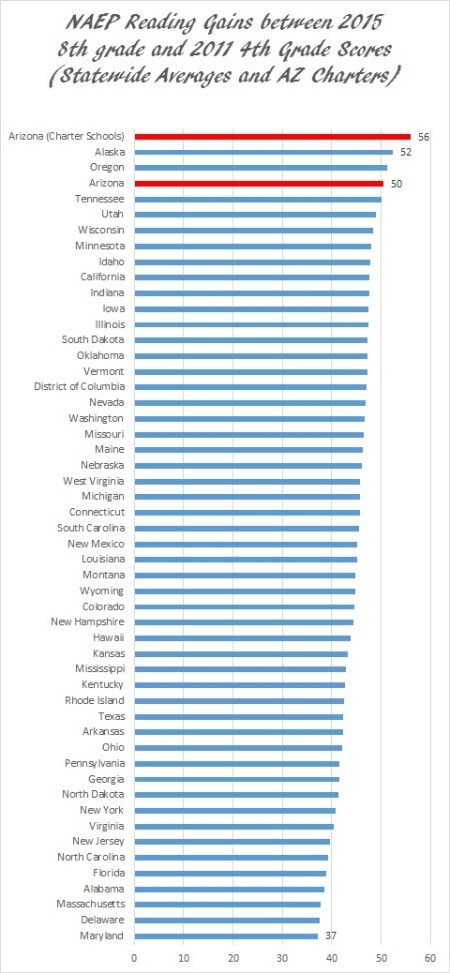
Given the Arizona’s charter schools rank near the top in over NAEP scores, and first in overall NAEP cohort gains between 2015 and 2011, they have a great deal to celebrate- as does Arizona as a whole. Nothing in these results makes a case for complacency Arizona has only numerically exceeded one of the national averages on the four main NAEP exams, and America remains a low performing nation. Nevertheless if this is what getting an F on the Ravitch report card looks like, what can we do to get an F minus minus?


What Can We Learn From Arizona’s Model Of Education Delivery ?
What is a reasonable conclusion from these charts?
That Arizona scores are the best because Charter Schools produce excellent results and in the overall state scores they pull the scores up.
Or:
That Arizona scores are the best because high scores from Charter Schools — and higher public school scores due to competition — result in a combined high overall score.
I would like to know, in the state scores, if Home Education students and private/independent schools are also part of the overall score.
I’m impressed by the statistics and am interested in the cause/effect/correlation implications. I’m no statistician but am interested in the compulsory attendance issue, education choice issue, and parent vs state responsibility issue.
I’m really intrigued with the dynamics going on in Arizona. From Tom Patterson’s article he says: “Arizona’s secret weapon must be school choice and competition . . . The bad old days of a public monopoly dictating where students must attend school are mostly gone. Consumer choice and competition produce quality results in other fields of endeavor, and the same principles seem to be working in education also.” He says he is disappointed that public reaction to Arizona’s exemplary education achievements is “nearly non-existent”.
Matthew Ladner’s charts and wild raving visuals do not do justice to Arizona’s success especially in a state with one of the lowest per pupil state expenditures in the nation. Maybe there could a down-to-earth news release to explain the significance of the figures and the value-added effect. After all, we do NOT send kids to schools to come out 12 years later as zeros! There has to be value resulting, and, that does not necessarily mean more funding.
Why is Arizona a value-added champion in education?
TA-
Like any complex phenomenon there are multiple possible explanations of both the policy and non-policy variety. You correctly note that per pupil spending declined after the Great Recession. Unlike other states with strong central influence from the state capitol, benign neglect might be the most accurate and charitable explanation of the overall influence of state policy on the field with a few notable/arguable exceptions.
The big thing that stands out about AZ is that we have the highest state % of kids attending charter schools. Before the Great Recession the charter schools were mostly relieving pressure on the enrollment growth of districts, but once the Great Recession hit and enrollment growth stalled they began putting real competitive pressure on the districts- maybe the first acute pressure felt at a statewide basis in American history. This will likely lessen as enrollment growth fires back up, but for the first time in state history you had districts losing not just market share but actually seeing declining enrollment in absolute terms.
To their credit, rather than withering up and dying, the districts have improved the academic outcomes of their students over time. Overall it is a very positive story from the taxpayer and student standpoint- outcomes improving, efficiency increasing.
From the point of view of a provider, it feels a bit like having your coal squeezed into a diamond.
Since Arizona made these gains while expanding school choice and decentralizing regulatory authorities, there’s no danger of a Fordham style cargo cult developing there.
So all I have to say is, celeNAEP good times!
[…] how Arizona’s “Wild West” charter sector performs. As education analyst Matthew Ladner has detailed, Arizona’s charter sector not only outperformed the state average for gains between the 2011 […]