CeleNAEP for AZ Charters continues in AZ Merit Scores

December 4, 2015

(Guest Post by Matthew Ladner)

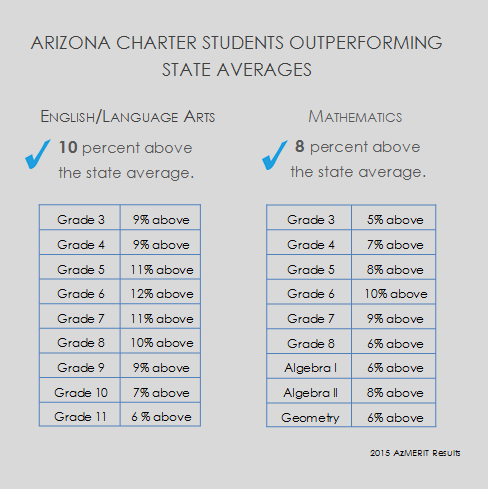
Laissez le bon temps rouler! The AZ Department of Education released results of the new AZ Merit test, and the Arizona Charter School Association released a breakdown of the scores showing that AZ charter school students scored 5%-12% higher scores depending upon the grade level/subject (see below).

Sadly the AZ Merit data comes in the form of an excel spreadsheet rather than a NAEP-like data slicer, so a control for differences in student demographics, program status, etc. cannot be readily performed. Some of the differences in scores between AZ charters and districts are likely to be explained by student differences. When you examine the NAEP, it is also the case that some of the differences between New England states and a state like Arizona will also be explained by student differences. No one I know however doubts that the average public school in MA outscores the average public school in AZ.

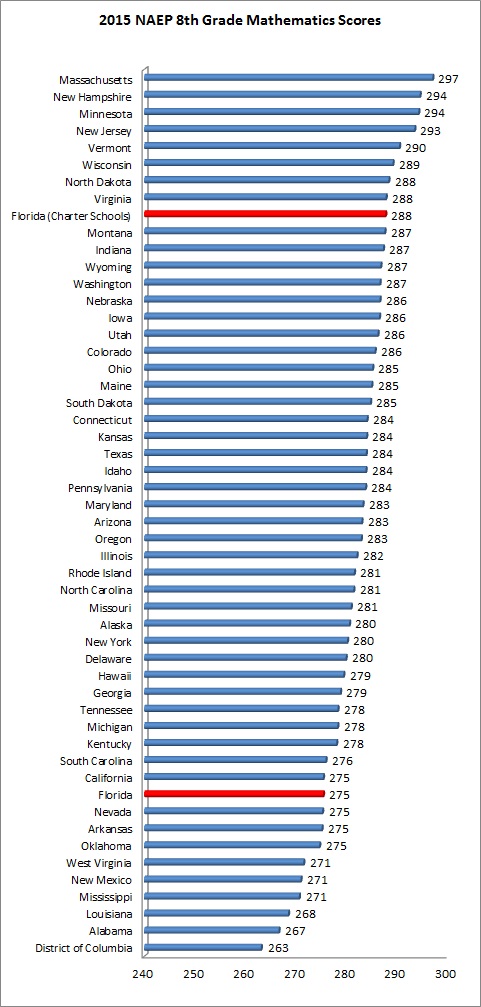
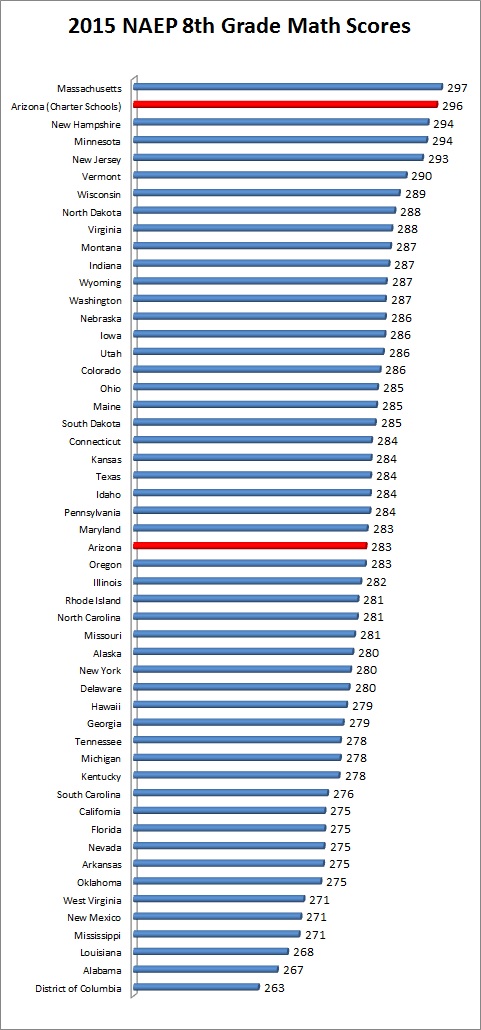
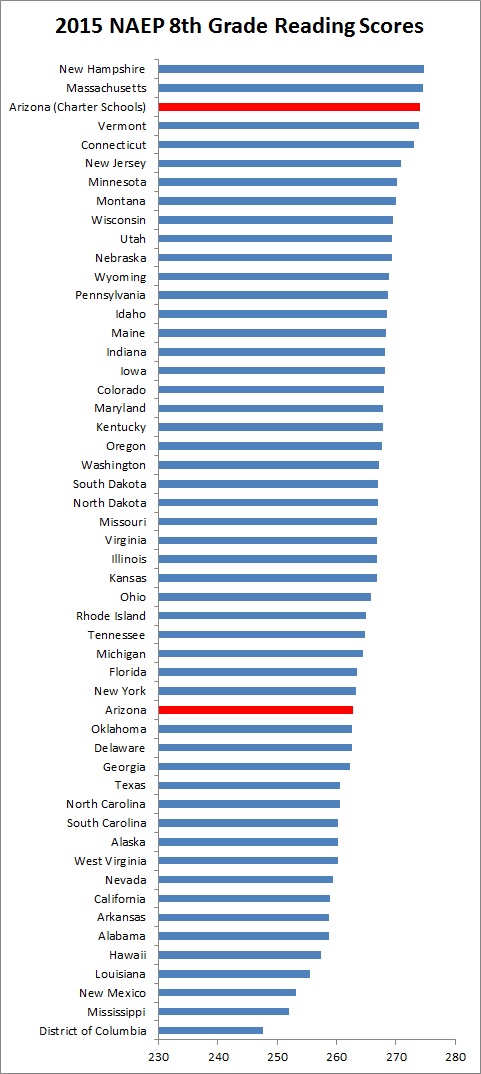
AZ Merit aligns much more closely to NAEP in terms of student results than the jumped the shark over a decade ago AIMS test. The differences observed in raw scores are generally larger than those existing between the top NAEP state (MA) and Arizona. The AZ Merit scores therefore reinforce the NAEP data’s finding that Arizona charter schools have something special cooking out in the cactus patch.

Korea- your scores are next!


Slice and Dice the Data but Arizona Charters Continue to CeleNAEP Good Times

November 16, 2015

(Guest Post by Matthew Ladner)

So I’ve still been digging into the AZ NAEP data. When something seems too good to be true, it is best to assume it isn’t true. I decided to investigate the possibility that something goofy was going on with the free and reduced lunch variable. Not all  Arizona charters choose not to participate in the program, and the eligibility criteria for the program has changed over time.

Parental education may be a good stand-in for what may be a suspect income variable. At the 8th grade level, the NAEP data slicer has an a variable for parental education. The below figure presents the 8th grade math scores for students with college graduate parents. In order to account for possible differences in special program participation, the figure is only for general education students with college graduate parents (the ranking results don’t change much if you look at all students). I will again stress that these comparisons do not substitute for a proper random assignment study-only that they tell us more than an examination of aggregate scores for all students.

NAEP AZ charter 8m parent educ

Watch out New England…Arizona charter schools are coming to get you!

For you incurable skeptics, the below figure presents the same comparison using 8th grade reading, and bear in mind that each NAEP test involves a different sample of students.

NAEP AZ charter 8r parent educ

We can also look at these numbers by race/ethnicity. NAEP provides subset numbers for Anglos and Hispanics attending charter schools in Arizona. Here is the NAEP 8th grade reading test for Hispanic students:

AZ Charter 8r Hispanic

And here it is for Anglo students:

AZ Charter 2015 NAEP 8r Anglo

Okay but what if those Arizona charter schools are chock full of Anglo kids whose parents graduated college? Now the National Alliance of Public Charter Schools reports that Arizona charter schools have a majority-minority student body, so this is not the case- but what if a large portion of the Anglo kids attending charter schools have parents with college degrees? Ok, well, let’s compare Anglo kids whose parents graduated from college:

AZ Charter 2015 NAEP 8r Anglo college

Did I mention the part where Arizona charter schools did this with $8,041 per kid in public funding? Better results at a lower cost is what America is going to need very soon- and well here it is. Massachusetts NAEP scores taste like chicken btw, only gamier, could use a little salt.


CeleNAEP Good Times-C’MON!

November 5, 2015

(Guest Post by Matthew Ladner)

My #Shadowfaction partner in crime Lisa Graham Keegan and I hit the pages of the Arizona Republic to celeNAEP good times in Arizona. Teaser trailer:

NAEP has given 40 exams on mathematics and reading to representative samples of Arizona students in various years since the early 1990s. As a low-income state with more than its share of student challenges (high poverty and non-native English speaking rates), Arizona has never met or exceeded the national average score – until now.

Arizona’s eighth-graders edged out the national average in mathematics and only narrowly missed doing the same in reading. Therefore, Arizona’s Class of 2019 carries a special distinction in state history – one that future classes can both match and exceed. Achievement has improved substantially since the last pre-recession measures in 2007.

Of notable attention are Arizona’s charter-school students, who matched the scores for the highest-scoring states on the 2015 NAEP. On eighth grade mathematics, for instance, Arizona charter students scored in a statistical dead heat with Massachusetts, the highest scoring of the 50 states.


Arizona charter schools rocked the 2015 NAEP so hard that…

November 4, 2015

(Guest Post by Matthew Ladner)

,,,they scored the same as the nationwide number for private school students on the NAEP 8th grade math test in 2013 and 2011 (no new private school number in 2015). I’m not sure what to say about this other than:


The Mystery of the Math Swoon

October 30, 2015

FL Charter 2015 NAEP 8m

(Guest Post by Matthew Ladner)

So nationally 8th grade math scores declined by three points. That’s not good but on a 500 scale point test it isn’t clear that it is anything to get too excited about, although it interrupted a long-term positive trend. Florida’s 8th grade math scores however declined by six points. That’s more worrisome.

So digging around in the data reveals that Florida charter schools were unaffected by the swoon- their 8th grade math scores were flat between 2013 and 2015- and delightfully high to boot (see chart).

The Trial Urban District Assessment has information for Miami-Dade and Hillsborough County (Tampa area). Here’s where the mystery deepens- Miami was also unaffected with flat scores between 2013 and 2015. Hillsborough however:

8 point drop in the Tampa area according to TUDA. If there is any rhyme or reason to this I can’t discern it. Some of the national meta-explanations I have seen bandied about don’t seem to work to explain trends in Florida. For instance some have pointed the finger at Obama’s state waivers. There may or may not be something to that nationally, but Florida schools all operated under the same waiver. Standards/testing transition issues likewise impacted all schools-is there some reason why Miami and charter schools should brush this off while the state as a whole did not? Something peculiar may have happened in Hillsborough but Tampa is not big enough to do a huge amount of damage to Florida’s statewide average.

I’m stumped, but always happy to employ the wisdom of the crowd. If you have bright ideas or wild speculation to offer, that’s what the Jayblog comment section was made for!


Arizona charter students ROCK NAEP 4th grade math as well

October 29, 2015

(Guest Post by Matthew Ladner)

Well just to keep anyone from saying “oh yeah- but he didn’t show us 4th grade math!”

AZ charter schools 2015 NAEP 4m

My reaction:

and


So while they were at it Arizona Charter Students Rocked the NAEP 8th grade math exam too

October 29, 2015


(Guest Post by Matthew Ladner)

AZ Charter 2015 NAEP 8m

So we may be able to rule out the weird sample theory since NAEP has different random student samples for each test. On 8th grade math AZ charter school students scored in a statistical dead heat with Massachusetts. While there certainly is a self-selection factor in terms of parents applying for charter schools, I can tell you that every way I found to break the above numbers down shows a charter school advantage- charters scored better among low-income kids, and among middle/high income kids. They scored higher among Anglo kids and among Hispanic kids. Because charter school students only make up 17% of the student body, the NAEP data can only go so far in slicing and dicing data.

The point isn’t that self-selection had nothing to do with these results-they obviously did although we have a growing mountain of random assignment data from around the country that shows admission lottery winners outperform lottery losers. The most important points- first tens of thousands of Arizona parents sit on the outside looking in at charter school spots. Second- both district and charter results have improved in Arizona through a very difficult period of funding cuts for both sectors.

Congratulations to all of Arizona’s long suffering educators and leaders. We’re not there yet, but we are on our way.


Arizona Charter Schools Score Like a New England State on 2015 NAEP

October 29, 2015

(Guest Post by Matthew Ladner)

Previously I had shown that if you compare general education low-income students, that Arizona charter schools made very large academic gains on the 2015 NAEP. This morning I woke up and thought: what if we compared Arizona charter school students to other statewide averages as a whole? Arizona has the highest percentage of students attending charter schools of any state. There are more students attending Arizona charter schools than Wyoming public schools after all, so why not?

I ran the numbers for 8th grade reading. Here are the results:

AZ Charter Schools 8th grade reading NAEP

Well how about that? Now before you start babbling conspiracy theories about student demographics let me remind you of a few things. First of all, those states up at the top are all very pale complected, host Ivy League universities and have average family incomes in the six figures. Arizona meanwhile is a relatively poor state with a plurality of Hispanic students and a law which requires random assignment lotteries to charter schools. I don’t have statistics for the percentage of Hispanic students in Arizona charter schools but having visited many of them I can assure you that it will beat the living daylights out of the same figure for New Hampshire. In other words if you want to wildly speculate about student demographics you can lick the strings of Angus’ electric guitar while he has it plugged in to his portable nuclear generator necessary to burst your ear drums and make you love it.

Did I forget to mention that Massachusetts probably spends more than twice the amount per pupil when compared to Arizona charter schools? No? Ok well that too.

Well, maybe the 8th grade reading sample just happened to over-sample the highest performing charters in 2015. Could be-so let’s check the 4th grade reading numbers:

2015 4th grade reading NAEP AZ Charters

So it’s not much of a mystery to see why tens of thousands of Arizona parents sit unhappily on charter school waiting lists- the gap in scores between AZ charter schools and the AZ average is considerable. This is not to say that every Arizona charter school is fantastic (they aren’t) or that every AZ district school is low performing (this is not the case). Moreover Arizona district schools have been improving while dealing while a great deal of adversity since 2007 and in the end this is absolutely crucial. Key to that progress however is a growing little New England scoring school system out here in our delightful patch of cactus.

Arizona Governor Doug Ducey campaigned on funding the wait list- getting more resources out to district and charter schools with long wait lists to get more of them in the door and off the list. I hope the above charts indicate just what a profoundly wonderful idea that would be, so…


NAEP 4th Grade Reading Gains for low-income children, 2003-2015

October 28, 2015

NAEP Reading 2003-2015

(Guest Post by Matthew Ladner)

All states started taking NAEP in 2003. Some jurisdictions (**cough** DC **cough** Florida) scored big gains before 2003, but hey they are near the top anyway. DC is your winner, more to follow.


BOOOOM! AZ charter schools RAWK the 2015 NAEP

October 28, 2015

(Guest Post by Matthew Ladner)

Arizona did well in the 2015 NAEP- up in three of the four tests and notched our first ever above the national average score in any of the four exams. This is all good news, and the gains look more impressive if you compare them to when the economy hummed and spending per pupil was relatively high (2007) to when not so much yet (2015). Sweet are the uses of adversity if surely very difficult for educators and administrators.

I ran numbers for charter vs. non-charter and tried to get closer to apples to apples by examining the scores of general ed students who qualify for a free or reduced lunch. If your story is that the charter schools have a nefarious plot to siphon off all the rich kids from North Scottsdale (good luck btw) these are not those kids.

AZ charter NAEP 2015

Some of the really big gains on the charter side here may be explained by an unusual bad showing for charter schools in 2013-and that could relate to the vagaries of NAEP sampling. Nevertheless they are way up from the good ole days of property bubble prosperity as well as from 2013 among both districts and charters- and the most important gains are the blue ones since they still educate 83% of the kids.

So that’s what you get for you “wild west” charter sector that routinely derided by overly cautious types who have no experience with coping with rapid enrollment growth- rocking academic gains for disadvantaged kids! Arizona still has far to go but…