Opening Salvo in NYC Charter War

February 28, 2014

(Guest Post by Matthew Ladner)

And so begins New York City Mayor de Blasio’s war on charter schools.  I had almost become accustomed to the idea that the Right had a monopoly on absurd circular firing squad style education debates, but as Rotherham and Whitmire note the reformer versus teacher union sock puppet battle is alive and well on the Left and coming soon to a town near you.

Unlike the cries of pundits either desperate for attention or hoping to finally get their Wile E. Coyote ACME Curriculum in a Box scheme to somehow work from the top down this time, the battle on the left has some very real and tangible victims. So far the toll looks to include hundreds of children who will be losing the opportunity to attend a high-quality school.  These are real parents, real children, and very high-quality schools being stripped away.

New York City does not lack for Democrats with a deep commitment to charter schools. Let’s see if they rise to the occasion for these kids.


Whose Tribe Wanted This?

January 27, 2014

(Guest Post by Matthew Ladner)

Last week on NRO Kathleen Porter Magee wrote what reads like a lament for the death of the center-right education reform coalition:

(W)e must resist the centrifugal forces that threaten to pull apart the core policies that together have made the conservative reform movement so successful. Narrowing the scope of this tradition by removing standards and accountability from the theory of change would be a remarkably shortsighted decision, with far-reaching consequences for everyone seeking reform.

I also regret the current controversies, but one has to expect a fight under the tent here and there.  Since actions speak louder than words, I’m guessing it is going to take more than broad expressions of regret to stop this one, even after the current Common Core controversy fades from relevance.

My recollection of how this fight under the tent started would begin with this self-indulgent attack followed by more expression of poor reasoning by the standards tribe like this. Quoting Hirsch:

The choice movement is a structural approach. It relies on markets to improve outcomes, not venturing to offer guidance on precisely what the schools should be teaching. Such guidance would go against the “genius of the market” approach, which is to refrain from top-down interference with curriculum. Stern shows—rightly, I believe—that this is a fundamental failing of the choice movement.

Ironically enough, Dr. Hirsch fails to recognize that a great many schools that have opted in to his benevolent guidance are choice schools of various sorts.  This seems truly odd given that these schools are listed on his own website.  More than a few leading lights of the standards movement, while undoubtedly learned, seem to lack a basic understanding of pluralistic interest group competition. Who drove the classics out of the American public school curriculum in the first place? Why would you expect it to be different in the future?

Here in Arizona the Great Hearts schools have revealed an almost insatiable parental demand for a rigorous classical education- they have 6,000 students, 10,000 students on waiting lists, and every time they open a new school their waiting list grows rather than shrinks.   If you are having trouble understanding why the districts were basically oblivious to this demand before the advent of the dastardly “structural reform” some remedial course work in political science is in order. To the limited (but growing) extent that a classics based approach is proceeding in Arizona districts it is because the combination of parental demand and (**gasp**) charter schools and even more wildly liberal home-schooling movement has created the incentive to move in that direction.

KPM to my knowledge is not responsible for any of this, and this is all in the past. More recent stuff like this however certainly does not help. State testing may be a near total disaster in a great many states, but that’s no reason not to apply it to choice programs. Egads.

The tension between the standards and choice movements boils down to one between centralization and decentralization. It is not impossible to reconcile these urges, but a necessary if not sufficient step on the part of the standards tribe will be to show greater respect for diversity and self-determination. Until such time, remember whose tribe wanted this fight.


DC District Schools are Improving Fast but not Fast Enough to Catch DC Charters

January 23, 2014

(Guest Post by Matthew Ladner)

When the National Center for Education Statistics first released the 2013 NAEP data, the website refused to cooperate with requests to give charter/district comparisons for the District of Columbia.  This is of especially strong interest given that 43% of DC public school children attend charter schools.

Well lo and behold the NAEP website decided to start cooperating, and the data tells a pretty amazing story: district schools are improving over time in DC, but charters show even stronger growth.

NAEP takes new random samples of students in each testing year, but judges performance consistently across time. Making comparisons between district and charter students isn’t easy.  The percentages of students in special programs for children with disabilities and English Language Learners can potentially impact average scores. So for instance if DC charter schools have fewer children with disabilities enrolled, or fewer ELL students, or fewer low-income children enrolled, they could appear to be doing a better job educating students when the truth could be quite different.

Fortunately NAEP allows us to take these factors into account.  The charts below show NAEP data that gets as close to an “apples to apples” comparison as possible, comparing only the scores of Free and Reduced lunch eligible students in the general education program. Two other sources of bias that could be expected to work against charter schools involve new schools and newly transferred students. Organizations tend to not be at their best during their “shakedown cruise” and schools are no exception.  Also students tend to take a temporary academic hit as they adjust to a new school after transferring.  Charter schools tend to have lots of new schools full of kids who just transferred in-providing a double whammy when looking at any snapshot of performance.

Unfortunately, NAEP does not contain any tools for taking the age or the school or length of enrollment into account. Thus DC charter schools are fighting at a bit of disadvantage, and a very substantial funding disadvantage, in the below charts.

DC charter 1

DC charters may be fighting with one hand tied behind their back, but it did not stop them from scoring a knockout on NAEP. DC charters widened their advantage in the percentage of children scoring “Basic or Better” from 4 points in 2011 to 9 points in 2013.

DC charter vs district 8r

DC district students saw a large improvement in 8th grade reading between the 2011 and 2013 NAEP, but still found themselves trailing the achievement of DC charter students by 5%. In 4th Grade math, district students scored a very large gain, but charter students achieved an even larger improvement.

DC charter 3

On 8th grade math, district students demonstrated impressive gains, but DC charter students were 19% more likely to score “Basic or Better.”

DC charter 4

Hopefully the race to excellence will continue and even accelerate. Meep! Meep!


Arizonapocalypse

November 19, 2013

(Guest Post by Matthew Ladner)

Last week the Arizona Board of Regents released a report detailing the catastrophic failure of Arizona high-schools in preparing students for higher education.  Specifically the report traced the high school class of 2006, finding that half of the high-schools had five percent or less of students finishing higher education degrees or certificates within six years.  A mere 40 of the almost 460 schools produced 61% of Bachelor degrees in the AZ Class of 2006.

So, the news could have been much better. Here is the next shoe to drop- things are going to be getting increasingly more difficult in the years ahead.

The United States Census has produced population projections by state. Let’s see what the future has in store for Arizona. First a little context. Arizona’s current population is was about 6.5 million in 2012.

First challenge- a very large increase in the youth population.

Arizona Under 18

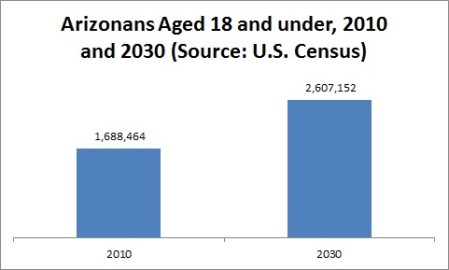
The Census Bureau projects a large year by year increase in young people.  The Census has projections for the 18 and under population, and also for the 5-17 population.  The 0-3 population is generally outside of the pre-school and K-12 system, meaning that the 18 and under population overstates the impact that the increase in the youth population will have on the state budget in 2030.  The 5-17 year old figure understates the situation due to 4 and 18-year-old students who will receive either preschool or K-12 assistance.

The next chart uses the Census Bureau’s projection for the increase in the 5-17 year old Arizona population, and puts it into context by comparing it to the size of the charter school and private choice populations of Arizona.  Arizona’s charter school law passed in 1994, and the scholarship tax credit program passed in 1997. The time between then and now is roughly comparable with the time span between now and 2030.

Arizona 5-17

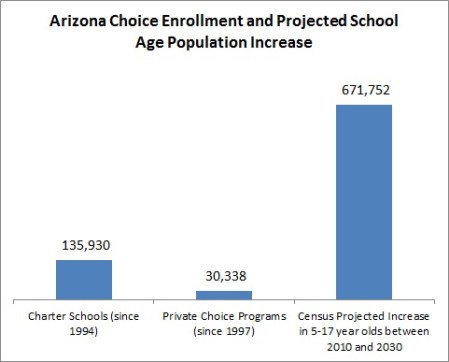
Arizona school district enrollment is set to expand regardless of what we do on the parental choice front, just as it has for the last two decades. In the last two decades, the charter school law has produced a large number of those 40 schools that produced 61% of the BA degrees. In combination with the scholarship tax credit programs and the still nascent ESA program, they have taken the edge off of district enrollment growth in the aggregate.

Arizona does have high-quality charter operators who will continue to slowly but sure increase the islands of quality.  If the ESA program survives court challenge it may allow for a quicker pace of private choice expansion than the tax credit program. Creative destruction of the sort that might actually close dysfunctional schools, other than charters that fail to launch, is simply not in the cards.  The districts full of those 5% and under high schools will be going into the debt markets to build more dropout factories.

Or perhaps they will be running double shifts at the current dropout factories, as it will become increasingly difficult to finance new construction.

At precisely the same time Arizona will be dealing with a surge in the youth population, an even larger problem looms the growth in the elderly population. Again from the Census projections:

Arizona Elderly

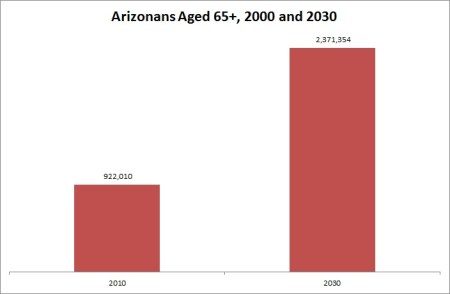
For those of you squinting to read the numbers, that is an increase from 922,000 65+ year olds in 2010 to almost 2.4 million in 2030.

So let’s sum up the story so far- Arizona’s K-12 system currently does a very poor job in educating anything more than a thin slice of students.  Arizona has a vast increase in students on the way to coincide with an even larger increase in the elderly population.  Still with me? Okay, let’s keep going.

Demographers calculate age dependency ratios, and economists have found that they predict rates of economic growth. An age dependency ratio essentially compares the number of young and elderly people in a population to the number of working age residents. The logic behind the notion is that young people require a heavy investment in social services (primarily education) while the old also require a heavy investment (primarily in the form of health care and social insurance retirement benefits).  From the perspective of a state budgeting agency, young people don’t work, don’t pay taxes, and go to school. Older people are out of the prime earning years, often heavily use Medicaid. An age dependency ratio basically tells reveals the number of people in the young/old categories compared the number of people in neither category (i.e. people of typical working age).

The United States Census Bureau calculates an Age Dependency Ratio by adding the number of people aged 18 and under to the number of 65 and older and dividing it by the number of people aged 19 to 64. They then multiply the figure by 100 just to make things tidy. The formula looks like:

Age Dependency Ratio = ((Young + Old)/(Working Age)) * 100

Many people continue to work and pay taxes past the age of 65, making it inappropriate to view them as “dependent.” It is also the case however that many people above the age of 19 are still in school and thus are not yet working and/or paying much in the way of taxes. We all probably know hyper-productive 70 year olds and people in their 20s engaged in a six-year taxpayer subsidized odyssey of self-discovery that will not number “graduation” among an otherwise wonderful set of experiences. During periods of prolonged economic difficulties, moreover, it is obviously the case that lower rates of working age people will in fact be working, and thus making taxes.

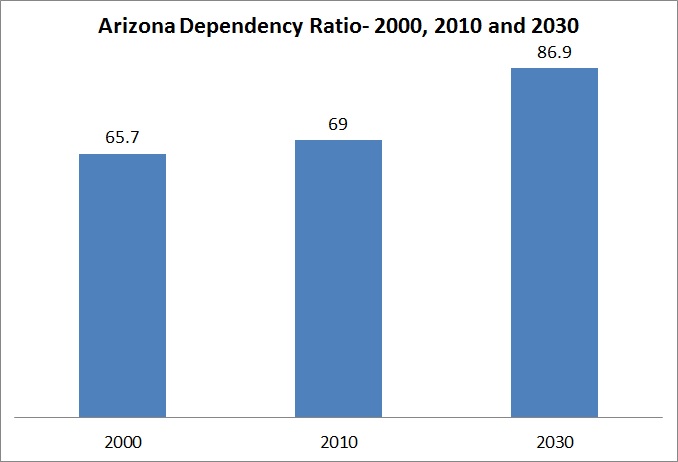
Notwithstanding these important caveats, the broad idea behind age dependency ratios is to roughly assess the number of people riding in the cart compared to the number pulling the cart at any given time. People of course both benefit and pay into these programs at different stages of life, but the current ratios serve as a measure of societal strain.  What does the age dependency ratio for Arizona look like?

Arizona Age Dependency Ratio

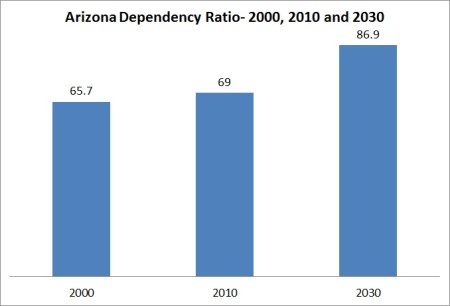
Note that Arizona’s age dependency ratio in 2010 was already among the highest in the country. A social welfare state with 86 people riding in the cart for every 100 pushing it will not compute. In 2030, the Class of 2006 will be squarely among those expected to push the cart of the Arizona social welfare state.  How alarming and unfortunate then that many of them dropped out of high-school, and many more of them dropped out of college. The most immediate way Arizona can help address the looming crisis of 2030 is to get more students educated now.

I’m not sure how this plays out. I am certain that we have been thinking too small given the size of our challenges.


I’ll Have What Florida Charter Schools are Having

November 7, 2013

(Guest Post by Matthew Ladner)

Florida’s charter schools totally crushed the ball on the 2013 NAEP Reading test- an 11 point gain in 4th grade reading and a 5 point gain in 8th grade reading. As the number of charter schools in the state has gone up, the ability of NAEP to reliably sample them has improved.

Getting about as close to an “apples to apples” as you can get in the NAEP data by comparing only low-income general education students still shows huge gains and a big advantage for Florida charters to Florida district schools.

Florida charter 2013 NAEP


17,000 march in support of Charter Schools in NYC

October 10, 2013

(Guest Post by Matthew Ladner)

Looks like a big battle looming in Gotham.  I predict DeBlasio’s notion of charging rent to certain types of public schools (charters) but not to others (districts) will end in tears one way or another if he is foolish enough to pursue it. Equal protection under the law anyone?

NYC charter supporters should be calling Clint Bolick about now.


Common Core Made J.D. Tuccille’s Son Cry

October 3, 2013

image

(Guest post by Greg Forster)

Do. Not. Miss. This awesome article over at Reason on how Common Core is already destroying options for parents.

My son’s charter school focuses on rigorous academics. Even so, as third grade kicked in this year, so did a lot of tears during homework time. Tony’s teacher explained to us that the kids are having a rough time, especially with math, because they didn’t just jump up to third-grade lessons and expectations as usual, but are now expected to meet Common Core standards. We may have picked a charter, but it’s publicly funded, and so the new standards apply.

Don’t agree with the CC PLDDs about what kids should learn and when? TFB.

“Pre-algebra?” my wife, a pediatrician who deals with children and tracks their physical and mental growth every single day, asked. “I’m not sure third-graders are developmentally ready for this. Their brains may not be able to handle it yet.”

But ready or not, my son is held to those tear-inducing standards—the identical standards that bind his friends at the International Baccalaureate school, and the Montessori charters in town, and the district schools, and the Waldorf charter down the road. Forget educational emphases, or philosophical differences over the pace at which different children should learn. The benchmarks will be met, or else.

Private schools are under the gun to conform as well, because the college entrance exams are strutting around bragging that they’re mega-super-CC-aligned and are going to become even more so.

CC is doing for school choice what Henry Ford did for automobile color choice.


It’s a Blowout: Tom Vander Ark 4, New Gates PLDD Strategy 0

August 29, 2013

The research evidence continues to pile up that the old Gates strategy of promoting small schools of choice has proven effective according to rigorous random-assignment design studies, while the new Gates PLDD strategy of building a national system of standards, assessments, and consequences has virtually no rigorous evidence to support it.

Under Tom Vander Ark’s leadership the Gates Foundation not only pursued an agenda based on a plausible theory of school improvement, but also initiated a series of high-quality studies to assess the results.  Even though Gates has largely abandoned its old strategy, those results are now pouring in.  We previously saw positive outcomes from a study by Lisa Barrow, Amy Claessens, and Diane Whitmore Schanzenbach of small schools in Chicago.  A non-Gates-funded analysis by my students, Anna Egalite and Brian Kisida, showed the same advantage for smaller schools in a national sample.  And in New York City, MDRC also demonstrated significant gains from small schools of choice.

Now MDRC has an updated analysis confirming that the benefits discovered earlier were extended and endured.  Randomly assigning students to small high schools “continue[s] to produce sustained positive effects, raising graduation rates by 9.5 percentage points.”  In addition, “more students are graduating ready for college: the [small high] schools raise by 6.8 percentage points the proportion of students scoring 75 or more on the English Regents exam, a critical measure of college readiness used by the City University of New York.”

What evidence do we have to support the new Gates PLDD strategy?  Umm, well, I’m sure Fordham can gather some of their friends together and give higher letter grades to states implementing the Gates PLDD strategy.  Over $6 million can buy some really good grades.

This is what the Gates Foundation has been reduced to — an organization that used to commission the most rigorous evaluations of their reform theory now invests overwhelmingly in the marketing and spinning of their new reform theory.  And they couldn’t even stick with the old reform theory of promoting small schools of choice long enough to see whether the rigorous evidence supported it.

Small schools?!?  That is like so 2007.  I think I’ll tweet my friends all about it, since Gates is now more interested in Twitter counts than random-assignment research.  Can Gates please put a grown-up in charge, like bringing back Tom Vander Ark?

[UPDATE — An alert reader notes that the score is actually 5-0.  I forgot this study of small schools designed as early college.  Also, note the comment I added clarifying the nature of my concern with the $6 million given by Gates to Fordham.]


The world as you knew it at the end of the 20th Century…

August 15, 2013

(Guest Post by Matthew Ladner)

Derrell Bradford hits TEDx on digital disruption, choice and education:


Response to Charter Competition

August 6, 2013

Check out the new article in Education Next by my current and former students, Marc Holley, Anna Egalite, and Marty Lueken on how traditional public school systems respond to competition from charters.  Using an innovative technique they gauge the types of responses exhibited by a dozen school districts.  While traditional districts engage in some non-constructive reactions, like focusing on blocking or regulating charters to minimize the competitive threat, overall they find districts rising to the challenge in positive ways.  In particular they are finding that districts often respond to charter competition by  replicating charter practices, collaborating with charters, developing innovative schools and programs, and expanding school offerings.

Of course, this analysis does not demonstrate that these positive reactions are resulting in improved student outcomes.  But responding positively is the first step that we hope will lead to better outcomes.  It is certainly a big change from earlier analyses that found districts focused almost exclusively on fighting and blocking charters.  It appears school districts have come to realize that charter competition is here to stay and it is best to try to rise to the challenge rather than squash the competition.