Mr. Education: Matt Ladner. Dr. Ladner’s blogs on NAEP scores and the outstanding performance of Arizona’s charter schools, which put us in a statistical dead heat with top-performer Massachusetts, were must-reads for education wonks and those of us tired of reading only the bad news about Arizona’s K-12 system. Dr. Ladner offers readers a welcome and needed national perspective. We are lucky he is based here in Arizona. He’s the Paul Goldschmidt of education policy: he’s a gentleman, generous with his time, and produces the equivalent of quality at bats every game.
I have not felt so honored since being awarded the first (and as far as I know only!) Lifetime Bunkum from NEPC, and after that Mrs. Ladner had to my post bail and then drive me to the hospital. I mean who could have possibly suspected that Caesar’s Palace suites could catch fire? Jay and Greg tend to point fingers at each other. Or maybe it was Holly Madison and those tigers that are really to blame. Enlow just had to invite them back to the suite. In the end we all know that all roads of suspicion ultimately lead back to the Barbarian.
In any case it was a heck of a week until that happened.
But I digress…any time someone who could not jump rope to save his life gets compared to the great Paul Goldschmidt it’s time to celebrate, or better yet to CeleNAEP, just a little calmer this time! My sincere thanks to my great partners in reform at the Arizona Chamber of Commerce and A for Arizona.
I’ve been taking a close look at DC education, and I must say I’ve learned a lot- both good and bad. One of the bad things would be these charts from the Urban Institute showing that private schools are going the way of the Dodo in the District of Columbia. K-5 is above and grades 6-8 below:
A couple of notes: we’ve known for some time that charter schools hit private schools harder than districts- and well here you have it again. Also note that the collapse comes in spite of the DC Opportunity Scholarship Program starting in 2004. DC’s charter school law effectively operates as a universal school choice program that reliably delivers more than $14k in funding to all comers, but limits the universe of schools to young and/or startup schools.
The DC Opportunity Scholarship program meanwhile only offers a maximum of $8,381 per child for students in K-8, and unless it is both reauthorized and redesigned one cannot help but wonder if there will be many private schools for these students to attend in the years ahead. Please someone explain to me how it makes sense for a charter school law to operate as a defacto universal choice program at $14k per child, while the private choice program offers substantially less per child and only to poor children. The Urban Institute data clearly indicates that this is a recipe for extinction of the private school sector outside of elite institutions. To put matters bluntly- who in their right mind would seek to open a private school in preference to a charter school in DC under this system of finance? Did you miss the part where private schools have been dropping like flies while charter schools proliferate? The funding for charters is large, universally available and reliable. The funding for DC Opportunity Scholarships is small, restricted and uncertain.
It’s little wonder why a number of D.C. Catholic schools gave up the ghost a few years ago and converted into charter schools. The school financing system practically clubbed them over the head. I’d like to invite my friends from the pro-means testing wing of the private choice movement to reflect upon the viability of supporting DC style scholarship programs when those programs must compete with defacto universal choice programs with far greater funding. Who wins that battle? Sadly the universal program restricts eligibility to young/startup schools with limited curricular diversity- how does this make sense? If parents decide to extinguish private schools as a result of a remotely equitable competition, you won’t see me shedding any tears. Our currently policies however make it look like we are out to quash private schools kind of like, well, this:
Recently I made an off-hand comment about Arizona NAEP gains being like the problem with the orbit of Mercury. I decided that it would profit from some further explanation. Newtonian mechanics seemed to have everything figured out, with that nagging problem of the orbit of Mercury doing something it shouldn’t. The “problem” with the orbit of Mercury of course wasn’t really a problem at all. It turned out to be a problem with our incomplete understanding of how the universe works- as illustrated in the above video.
So just how do Arizona NAEP scores resemble the orbit of Mercury? The 2015 NAEP shows that Arizona charter school students scoring in the range of New England states. Arizona charter schools serve a majority minority student population and spend only $8,041 per student- about a thousand less per student than Arizona districts and far less than the average spending in New England states.
Arizona’s AZ Merit exam demonstrated even larger gaps between charter and district scores than the NAEP, providing external validation for the NAEP scores.
Look at those guys! Their NAEP scores are going to collapse!
A little before the release of the 2015 NAEP, Mike Petrilli offered a friendly bet of a beer to me and Lisa Graham Keegan that Arizona’s NAEP scores would go down between 2013 and 2015 based on economic difficulties. We both instinctively thought they would go up, and they did. We are thirsty Mike! Taking a longer term view of the entire Great Recession period however proves more revealing.
Arizona scores have improved at six times the national rate on 4th grade math, 7 times the national rate on 8th grade math, five times the rate on 4th grade reading and 2.67 times the rate on 8th grade reading. How did a state that saw a decline in inflation adjusted spending per pupil drop from $9,438 in 2007 to $7,828 in 2014 (see JLBC doc link above) manage to outpace the nation in progress by such a wide margin? District interests here have a non-stop mantra about Arizona’s relevantly low ranking in per pupils funding but, er, why are we outpacing the nation by such a wide margin even as our funding declines?
Whoa- that’s unpossible!
Something is wrong here- but it is not Arizona’s positive score trends. What is wrong is some very common assumptions about K-12. I’ll get to that below.
The reality of Arizona K-12 improvement is of course complicated and defies any single explanation, with big changes going on at the same time. One factor that obviously contributed and that we can quantify charter schools. The next figure shows the NAEP gains by subject/grade for Arizona students for districts and charters (2015 scores minus 2007 scores).
Some may attempt to dismiss the difference between charters and districts as a product of differences in student populations. Only a random assignment study could definitively test this assumption, but a large amount of evidence suggests which way such a (sadly non-existent) study would fall. Arizona charter students rank well when compared to statewide averages when compared to a wide variety of subgroups (general ed, White, Hispanic, etc.) While differences in student populations could explain some of the differences between Arizona charters and Arizona districts, they can’t be put to similar use in explaining why Arizona students outscore similar students in New Hampshire. Arizona law also require random lottery admissions, serve a majority-minority student population and the improvement we see in the district scores does not exactly sit comfortably with a massive brain drain to charters story. If all of Arizona’s brightest students were fleeing to charters, it would put a substantial drag on district scores. Instead we see district scores improving.
Arizona has a higher percentage of students attending charters than any other states, but that still only falls in the teens– 13.9% in 2012-13. Even so these gains are large enough to make a noticeable difference the aggregates:
The reason I was willing to take Mike’s friendly bet on 2015 NAEP scores- I believe that by far the greatest opportunity to improve K-12 lies in making more efficient use of existing resources. In the opening pages of his 2004 book Hard America Soft America: Competition vs. Coddling and the Battle for the Nation’s Future the astute observer Michael Barone noted the following:
Public schools for example may be the most notable example of a predominantly Soft institution-which helps explain why American children are confined mostly to Soft America. But as we will see, our schools have not always been so Soft; they have contained corners of Hardness, and there are signs they are getting Harder now.
“Coddling” is not a term one would use to describe Arizona public education during the 2007-2015 period. Declining spending forced both district and charter leaders to seek efficiency. The state passed a law forbidding schools from making reduction in force decisions exclusively on length of service- this was very wise. Ineffective/expensive workers should be the first to go in a reduction in force- the alternative being to RIF a much larger number of young employees regardless of their effectiveness. Federal stimulus and a temporary sales tax increase delayed the need for these adjustments-but only temporarily. During this period Arizona lawmakers began grading schools A-F, and the combination of (mostly) recession related slow population growth and expanded competition halted what had been a non-stop process of student population growth for districts. Charters continue to gain market share against districts- and now both a more rigorous state test and NAEP show a substantial academic advantage for charter students.
None of this is easy for district leaders. It’s not exactly the cold howling wind of market competition, but it is a much higher level of competition and transparency than that to which the K-12 folks feel accustomed. Their world has become less stable and more competitive-Harder to use Barone’s phrase. To their credit, many district leaders have embraced the challenge.
It’s very difficult. It’s also very good for children.
So half way through reading Matthew Ridley’s new book The Evolution of Everything I come across a perfect distillation of the background meta-narrative of the JPGB in the last paragraph of Chapter 13:
The elite gets things wrong, says Douglas Carswell in The End of Politics and the Birth of iDemocracy, ‘because they endlessly seek to govern by design in a world that is best organized spontaneously from below.’ Public policy failures stem from planners excessive faith in deliberate design. ‘They constantly underrate the merits of spontaneous, organic arrangement, and fail to recognize that the best plan is often not to have one.’
Out here in AZ- a central planner’s K-12 nightmare of Wild West chaos-since the bust of 2007 we’ve had NAEP gains between 2.5 to 7 times greater than the national average. What passes for a consensus on Newtonian mechanics back east will struggle to explain this- something is wrong with the orbit of Mercury! Best perhaps to ignore outcomes entirely- as the New York Times did in an article this summer about AZ K-12:
Arizona in particular has been crippled by several years of targeted cuts at the state level and local voters’ repeated refusals to raise property taxes to offset these shortfalls.
Thank you for your touching concern NYT, but I’m feeling pretty handi-capable about right now. I know states with budget cuts and dysfunction in central command are not supposed to make nationally enviable academic progress during a very trying period. We alas didn’t get the memo out here in the patch so we went and did it anyway.
Let’s the speculation shift from “are those AZ charter NAEP scores real?” to “did the NAEP underestimate the scores?” As the lovely Teri Hatcher once said:
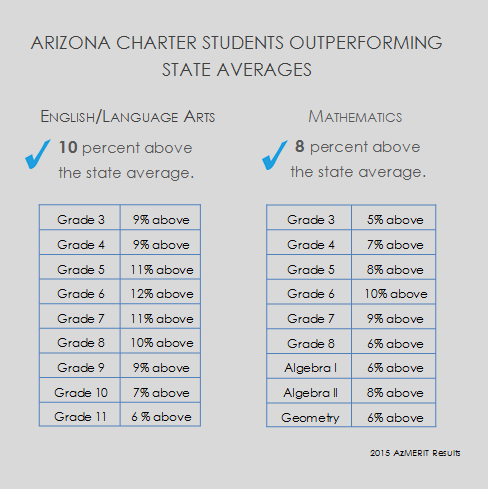
Laissez le bon temps rouler! The AZ Department of Education released results of the new AZ Merit test, and the Arizona Charter School Association released a breakdown of the scores showing that AZ charter school students scored 5%-12% higher scores depending upon the grade level/subject (see below).
Sadly the AZ Merit data comes in the form of an excel spreadsheet rather than a NAEP-like data slicer, so a control for differences in student demographics, program status, etc. cannot be readily performed. Some of the differences in scores between AZ charters and districts are likely to be explained by student differences. When you examine the NAEP, it is also the case that some of the differences between New England states and a state like Arizona will also be explained by student differences. No one I know however doubts that the average public school in MA outscores the average public school in AZ.
AZ Merit aligns much more closely to NAEP in terms of student results than the jumped the shark over a decade ago AIMS test. The differences observed in raw scores are generally larger than those existing between the top NAEP state (MA) and Arizona. The AZ Merit scores therefore reinforce the NAEP data’s finding that Arizona charter schools have something special cooking out in the cactus patch.
Hispanic students attending charter schools in Florida and Arizona both scored about a grade level ahead of Hispanic students attending district schools. Figure 1 shows where this lands them in terms of statewide averages for all students. Notice that Hispanic students attending charter schools in Florida are almost a grade level ahead of the statewide average for all students in Florida.
Nationwide all students in public schools scored 281 on 8th grade math in 2015. This means that AZ and FL Hispanic students ended in a statistical dead head with the average. Hispanic students in charter schools have gained 20 points in Arizona and 19 points in Florida over the 2005 averages. This reflects several things- including a lot of hard work by the students and teachers- but also perhaps maturing charter sectors with startups full of kids just transferring into the startup school impacting scores less than in the past.
So I’ve still been digging into the AZ NAEP data. When something seems too good to be true, it is best to assume it isn’t true. I decided to investigate the possibility that something goofy was going on with the free and reduced lunch variable. Not all Arizona charters choose not to participate in the program, and the eligibility criteria for the program has changed over time.
Parental education may be a good stand-in for what may be a suspect income variable. At the 8th grade level, the NAEP data slicer has an a variable for parental education. The below figure presents the 8th grade math scores for students with college graduate parents. In order to account for possible differences in special program participation, the figure is only for general education students with college graduate parents (the ranking results don’t change much if you look at all students). I will again stress that these comparisons do not substitute for a proper random assignment study-only that they tell us more than an examination of aggregate scores for all students.
Watch out New England…Arizona charter schools are coming to get you!
For you incurable skeptics, the below figure presents the same comparison using 8th grade reading, and bear in mind that each NAEP test involves a different sample of students.
We can also look at these numbers by race/ethnicity. NAEP provides subset numbers for Anglos and Hispanics attending charter schools in Arizona. Here is the NAEP 8th grade reading test for Hispanic students:
Did I mention the part where Arizona charter schools did this with $8,041 per kid in public funding? Better results at a lower cost is what America is going to need very soon- and well here it is. Massachusetts NAEP scores taste like chicken btw, only gamier, could use a little salt.


 Posted by matthewladner