So when you have this go on for years (huge gains for the well to do, not so much for low-income kids):
You wind up with this:
It is only with some reluctance that I raise this topic. In one of the editions of the Report Card on American Education we spent an entire chapter on achievement gaps and just how tricky they can be. West Virginia for instance, down at the bottom of the chart, had a low achievement gap a few years ago because both White and Black scores were declining, but White scores were falling faster than Black scores…but the achievement gap was closing….Huzzah?
Um, no.
In the end though the situation in DC is much more straightforward: White scores are really, really high while Black scores are really low. In the end there really isn’t much lipstick to put on an almost sixty point achievement gap pig. DC has the highest scores for White kids in the country by a 12 point margin but scores for Black students towards the bottom of the barrel.
In 2015 DC’s White 4th graders had a substantially higher score on the 4th grade math exam (274) than Black students attending DCPS had on the 8th grade exam (248). I’m no social justice warrior, but that should sicken anyone’s soul.
This is again a partially a reflection of the gentrification trend. The fact that more well to do families are staying in the District is very good for the financial health of the city. Most of DC’s school budget is locally generated and the rising affluence of the District has in fact generated an embarrassment of riches on the revenue per pupil statistics ($29k+ per year per kid).
Would that the District of Columbia Public Schools had made better use of it. The charter sector, with approximately half of the resources per pupil, Black students scored 18 points higher on the above exam. This cuts the achievement gap between Black students attending charter schools and White students in their enclaves of excellence in DCPS by approximately a third. Miles and miles to go to be sure, but at least the journey is underway.
Meanwhile back at DCPS…it can be very hard to focus.
DC has a long-standing spot in our thoughts as a poor urban district. While there certainly low-income folks with kids attending DC public schools, this image is in need of an update. Here is some data from the United States Census Bureau American Community Survey from 2014, DC is red:
So the percentage of families with incomes over $100k is comfortably above twice the national average, while the percent below $50k is slightly below the national average. Mean family income:
Whatever statistic you want to examine- median income, mean income, workforce participation, etc. it all looks better in DC. Once upon a time you could say this doesn’t necessarily reflect upon public school scores because the affluent sent their children to private schools. Ah, but recall that private school attendance has been collapsing in the district despite the presence of a private scholarship program:
So between private school enrollment declining and overall public (district and charter combined) enrollment increasing and average family incomes well above the national average, the socio-economics of DC public education have likely never looked more favorable than now.
In our next exciting episode of reviewing the DC education scene from the new study I wrote with Heritage we take a look at where the District remains despite a stunning level of investment and 25 years of improvement.
So let’s put DC into context in terms of revenue per pupil with data from the United States Census Bureau.
DC charter schools seem to be bringing in somewhere in the neighborhood of half of that figure on a per pupil basis. Now let’s see what the Trial Urban District Assessment NAEP has to say about how DC kids compare. The chart below compares kids on NAEP 8th grade math scores for students whose parents graduated from high-school but did not attend college. The hope here is to rank districts by kids not born on third base.
Note that if you do the same comparison by FRL status instead of parental education you still find DC ranked only ahead of Detroit and behind everyone else. The 17 point advantage for DC charter school kids in the above chart is considerable, but as the comparison makes painfully obvious, DC charters may be on their way, but they have not arrived. Still with less money and better scores the ROI is far, far higher than DCPS.
The heartbreaking part of the story however lies with the DCPS students. I’m not going to bother to look up the revenue per pupil statistics for Detroit but I am putting the over/under at half that of DC. Decades into DC reform efforts DCPS remains largely unchanged- far better at spending money than at teaching children, other than those who bought or worked their way into the high performing schools.
Next episode we’ll discuss what to do next. It shouldn’t involve continuing to bang our heads against the “better scores through improved management in an utterly broken system” wall. It also does not involve giving up.
The Capital is playing games with some limited success but low-income kids still hunger for academic gains.
(Guest Post by Matthew Ladner)
New study out today from the Heritage Foundation authored by yours truly on education in the District of Columbia. I will serialize the study a bit with a chart or two per post. The view I had of K-12 in the nation’s capital going into the project did not survive my investigation. My initial view going into the project is summarized in this chart:
Moving your 8th grade math scores from 230 in 1990 to 263 (combined district and charter) in 2015 is a lot of progress- by far the largest gains in the nation. While things are somewhat worse if we look at District of Columbia Public Schools (DCPS) scores alone (258) they still are far above the earliest measure. Better yet- when you examine charter scores in isolation from DCPS scores, the scores are higher still. Any actual education going on in DCPS back in 1990 looks to have been mostly accidental- I’m not sure what you would score on the NAEP math test if you just answered “B” every time, but with 3% of DC students scoring proficient and 83% scored “Below Basic” on the NAEP 8th grade math exam in 1990, it could not have been much lower. In 2015 19% of DC students scored proficient and only 49% scored Below Basic. The improvement is undeniable: time to CeleNAEP? Those gains dwarf anything seen out in the states, and the charter school sector getting close to half of the students is clearly a major driver of improvement. Twirl for me, girl on fire!
Alas while this story is true it is far from complete. What is going on in DC is both complex, partially encouraging and in the end very disturbing.
Overall enrollment in DC (district and charter) had been growing in recent years along with average incomes. A complex phenomenon is underway in which sophisticated young parents have figured out that they don’t need to move to Maryland or Virginia if they can find a spot in the right district or charter school in the District. In the end your kid doesn’t get educated by a district or a CMO but rather by a school. DC is the champion for NAEP gains, but it is also the champion for achievement gaps.
You can see the gentrification going on both in DC’s statistics and with the naked eye walking around town. Somebody keeps buying those million plus dollar brown stones and some of them are parents. This begs the question: how much of DC’s apparent academic gains owes to gentrification?
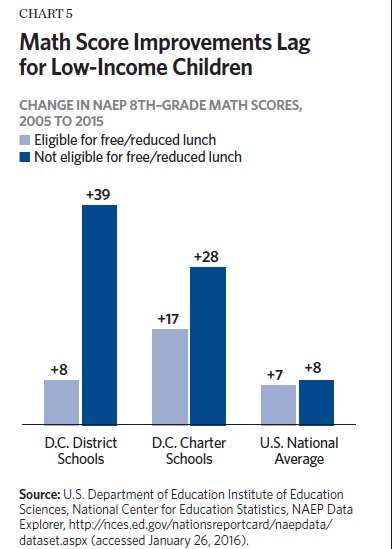
Sadly the answer is- affluent children have banked the vast majority of DC NAEP gains over the last decade.
There is a lot going on in this chart so pay close attention. These are again NAEP 8th grade math gains by family income (FRL status) over the last decade. First look at the light blue columns- gains for FRL eligible kids. DCPS district equals an 8 point gain, which is indistinguishable from the national average of 7 points. The 17 point gain for free and reduced lunch kids attending DC charter schools is the only real bright spot for disadvantaged kids in the public school system despite decades of reform.We used 8th grade math for purposes of illustration but you see a similar pattern across the NAEP exams.
Now observe the dark blue columns- DC kids whose incomes are too high for a Free or Reduced price lunch under federal guidelines. Here the gains are truly extraordinary- a 28 point gain for non-FRL kids attending charter schools and a 39 point gain for middle to high income district students. I’m placing my bet now that this isn’t solely due to schools in Georgetown doing an ever-better job educating kids with law-firm names, but also to the fact that people who once fled to Va and MD finding a spot that suited them in DC.
So in 1990 let’s estimate that the number of DCPS FRL kids scoring proficient on 8th grade math as effectively zero. Twenty five years later, that figure is up to 8 percent for district kids (charters excluded). DCPS in other words remains largely what it has always been- an organization far better at employing adults than meeting the needs of disadvantaged children. As we will see in a future post, the academic results of DCPS continue to disappoint even in comparisons against other urban districts despite 15 years of strong progress and gentrification.
I am Ozymandias-Queen of Queens! Look upon the ineffectiveness of my broom ye mighty and despair!
Overall the situation in DC K-12 is very complex- with both positive trends and heartbreaking stagnation. Regardless of where you are coming from on the political/philosophical side of things, if you are a DC taxpayer you should not stand for this state of affairs as it touches upon economically disadvantaged children. The above chart shows is that despite a truly shocking amount of tax effort and a decade and a half of reform, what DCPS has figured out how to do is to give the most academically to the kids born on third base. Mind you this is much better than giving approximately nothing to anyone a la DCPS circa 1990, but that is in the big picture a cold comfort. In the end it is very positive for the fiscal health of the District of Columbia that third base parents can in fact get a quality education for their children it in the right bits of DCPS. Moreover, those third base parents are paying a mind-numbing level of tax and they deserve a quality education for their children.
And it is also important to identify states that have weakened public education—by seeking to privatize their schools or turn them into profit-making ventures, as well as states that have aggressively instituted a regime of high stakes testing that unfairly sorts, ranks and demoralizes students, educators and schools.
Unlike other organizations such as The American Legislative Exchange Council (ALEC) and Michelle Rhee’s StudentsFirst, whose report cards rank states in relation to their willingness to privatize public education and weaken the status of the teaching profession, we take another path. We give low marks to states that devalue public education, attack teachers and place high stakes outcomes on standardized tests.
But…..there seems to be no consideration of outcomes going on in Little Ramona‘s report card. She pulled together some University of Arizona College of Education folks and they gave states a grade on various policies like “No High Stakes Testing” and “Resistance to Privatization” and others. “Chance for Success” is my personal favorite: why gather someone’s opinions about the chance for success rather than measure er actual success? In the Report Card on American Education that I have coauthored/authored for the American Education Exchange Council, we rank states according to the overall NAEP scores and NAEP gains for low-income general education students. We think this is a reasonable approach given the large differences between average family incomes etc. between states. Some disagree (and we claim only that the comparison is reasonable rather than perfect) but at least we are looking at student outcomes, which don’t even constitute an afterthought in Ravitch’s Report Card.
Anyway, my home state of Arizona received an overall grade of “F.” Quelle horreur!
Strangely enough though, if we conjure up the NAEP data and examine academic progress by state for the period in which all 50 states participated (2003 to 2015) this is what you learn about Arizona: in 4th grade math Arizona had the 9th largest state gains, in 8th grade math the 3rd largest. In 4th grade reading Arizona students had the 17th largest gain and in 8th grade reading the 2nd largest state gain.
Ah well Arizona’s demographics became more favorable during this period. Nope-economy got drop kicked and the student population moved to majority minority status. Yeah but spending went way up. Er, no, it actually wentdown after the Great Recession. But maybe the scores would have gone up even more without all of these terrible policies! Mmm hmmm….and maybe there is a breeding population of aquatic dinosaurs in Loch Ness as well. What do you mean no credible evidence? Maybe they eat their dead so dino bodies don’t wash up on shore. I mean it could be something stranger still going on.
Seems legit…
A few years ago I successfully campaigned to receive the first (and as far as I know still only!) Lifetime Bunkum Award from Reactionaries-R-Us. In that same spirit, I can’t wait to see what happens with Arizona’s gains once we earn our way to the first Ravitch F-minus!
UPDATE: I recalled the the University of Arizona College of Education played a large role in the creation of a charter school in Tucson called the Wildcat School. The Arizona Daily Star reported “When it opened, it was lauded as the first charter school to have an affiliation with a state university. Its goal was to provide an academically rigorous math- and science-focused education for low-income students.”
The school closed in 2013 after receiving two “D” grades in a row and facing the prospect of a third, which would have qualified the school for state intervention. The Board President, a professor at the U of A College of Education Professor explained “We just know we weren’t making the achievement test scores that we needed to make. I’m not sure I have an explanation for that,” he said. “We just faced the reality that we needed to act in a way that was best for the families and students in our school.”
Kudos to the board for pulling the plug on something that wasn’t working for kids. If I were a cynic I might note that they made a rational decision after getting themselves in over their heads, facing the prospect of an increasingly embarrassing situation. Thus under this uncharitable view they made the right call to pull the band-aid off rather than have things get progressively worse. You might very well think that, but I of course could never be so cynical. Ever. Ravitch hires University of Arizona ed school profs to grade state K-12 policies, they give Arizona and F. Meanwhile Arizona comes near first in overall NAEP gains. Professors from the same department essentially create their own charter school and it folds. Meanwhile Arizona’s charter schools rock the 2015 NAEP like a New England state.
I’m pretty sure I do have an explanation for that and it’s fairly straightforward- no aquatic dinos eating dead aquatic dino explanations necessary.
All students learn differently and should have the opportunity to attend a school that has the best environment for each student to be successful. This can be accomplished through
Education Savings Accounts, while still protecting school finances.
Senator Clark Jolley and Representative Jason Nelson have legislation on this issue. Send it to me and let’s give students and parents a better chance for educational success than they have today.
I do recognize these are some of the hardest things I’ve ever asked for your help to accomplish as governor. But they’re also some of the most important. We were sent here to lead, and we need to lead now more than ever. We have smart, capable people in this room and throughout state government. We can do this.
Now for people like me who support Arizona developing a set of standards unique to Arizona and replacing the current CC standards and possibly test so long as they are as good or better, the presence of Oklahoma on that last chart is a problem. For anti-CC crusaders, it’s an even a larger problem, unless of course you are just shameless is your support for tests that a chimp could sometimes pass blindfolded. Yes Tex I am looking at you. A constructive vote of no-confidence remains a respectable path to leaving CC in the rear view mirror, so I hope Oklahoma will pull it off in plenty of time for the 2017 NAEP.
Our pal Mike P. may be feeling a bit squeamish about ESAs, but rapper/actor LUDACRIS is ALL IN BABY! From the Atlanta Journal Constitution:
“Regardless to social status, all children should be able to access a great school,” said Ludacris. “Education savings accounts empower all children to be able to access a great education.”
No drink, drank or drunk…no pointing….and you have to take a shot with each triangulation hemisphere fallacy!
(Guest Post by Matthew Ladner)
Mike Petrilli created a taxonomy of school choice factions which is kind of fun. I agree with a good deal of it, especially the part about the interesting conversations now being between choice supporters rather than between choice supporters and opponents. Some of Mike’s take however strongly evokes Greg’s classic series of Hemisphere Fallacy posts: Faction one claims that the earth is a sphere, faction two insists that the earth is flat, so the real answer is obviously that the world is actually a hemisphere! Somewhere along the way these posts turned into a drinking game.
So in the taxonomy, Mike identifies JPGB as an oasis for “Purists,” identifies a more nebulous group of “Nannies” and then others as “Realists.” Mike identifies himself in the “Realist” camp.
Triangulation nudges one to exaggeration in order to create middle space to inhabit. Mike describes Purists as holding charter schools with suspicion, but a quick search through the JPGB archives will reveal dozens of reviews of charter school research, celeNAEPtion posts etc. for every “get off my lawn kid and take that Recovery School District with you!” post. Mike also describes ESA supporters as “utopian.” Someone put a link in the comments if you have seen otherwise, but I think the consistent theme in the ESA discussion has been their virtues vis a vis older models. I’ve made a consistent effort to describe our unfolding ESA experiment as a learning experience. I see an entirely reasonable path for real benefits, but I have never promised anyone a Workers Paradise or the New Jerusalem.
Or **ahem** “No Child Left Behind.”
I see questions over regulation within a system of parental choice to be an entirely appropriate topic for discussion and debate. It’s worth noting that from the very outset of the parental choice movement Milton Friedman called both for standardized testing and a certain degree of regulation. So in my mind thinking about this as a spectrum would make sense, but if I made a taxonomy it would look like:
Separation of School and State Extremists
Jeffersonian Freedom Fighting Sons of the Great Milton Friedman
Nanny State Busy Bodies
After careful consideration I place myself in the Jeffersonian Freedom Fighting Sons of the Great Milton Friedman…what?!? I did WHAT?!? Oh fine…
Let me take a moment to reiterate that in my home state I’m very comfortable with Governor Ducey’s goal to create a set of high academic standards unique to Arizona. I see little value in “common” standards (NAEP scratches my cross-state comparison itch) but I hate state tests that the Wall Street stock picking chicken could pass on his way to receiving a false state endorsement of “proficiency” with the burning hatred of a thousand suns. I have no idea where this will ultimately wind up and I can easily imagine better strategies than those adopted, etc.


 Posted by matthewladner