Arizona is the NAEP Value Added Champion of 2015

May 16, 2016

(Guest Post by Matthew Ladner)

Tom Patterson recently wrote a column about Arizona NAEP scores, and stated that Arizona had the highest overall gains in combined Reading and Math scores between the 2015 8th grade scores and the same cohort of students 2011 scores as 4th graders.  I decided to check it out.

NAEP has been following an odd number year cycle, meaning that the four-year gap between the same cohort of student can be measured. In this case, I took the statewide 2015 Math scores and subtracted from them the statewide 2011 4th grade math scores. We more commonly compare 8th grade scores to those of previous 8th graders, but measuring cohort gains is also of interest.

A note of caution before proceeding it is possible to do well on the below gains analysis without ranking terribly high. Likewise you could have the highest overall 8th grade scores but also had high 4th grade scores four years earlier and look meh in this particular analysis. Like achievement gaps, each state’s gain score requires a close look before drawing conclusions- but generally speaking the states with the biggest scores below would have started with modest 4th grade scores and then shown much higher scores for the same students as 8th graders. Obviously factors other than school system effectiveness could come into play (massive gentrification in the District of Columbia comes readily to mind) and every state will have students both come and go between 2011 and 2015.

Okay now that you’ve read the warning label:

NAEP Math Cohort gain 2015

In terms of context, Arizona’s 4th graders scored 5 points below the national average in 4th grade math in 2011 but two points higher in 8th grade math in 2015. There is nothing about starting below the national average that makes it inevitable you will crush the ball in gains. Alabama for instance had 2011 4th grade math scores 9 points below the national average but then displayed 8th grade scores in 2015 that were 14 points below the national average.

Reading gains below:

NAEP Reading Cohort gain 2015

Arizona’s 4th graders scored 8 points below the national average in 4th grade reading in 2011. As 8th graders in 2015 however this group of students had scores only one point below the national average- within the margin of error thus catching them up to the national average. In short, Tom Patterson nailed it- AZ looks to have had the best 2011 to 2015 period.

So this got me to thinking-what if we tracked the same cohort gains for Arizona charter school students and compared them to statewide averages? As we’ve noted before, with the largest state charter sector as a percentage of the population, Arizona has substantially more students than the entire public school system of Wyoming. The National Alliance of Public Charter Schools also compiles data about state charter sectors, so we know that the sector (like Arizona as a whole) has a majority minority student body.

Well this is what it looks like for Math:

NAEP Math cohort gains with AZ charters

Keep on rocking the free world! Similar story with reading:

NAEP Reading Cohort gain 2015 AZ charter

Given the Arizona’s charter schools rank near the top in over NAEP scores, and first in overall NAEP cohort gains between 2015 and 2011, they have a great deal to celebrate- as does Arizona as a whole. Nothing in these results makes a case for complacency Arizona has only numerically exceeded one of the national averages on the four main NAEP exams, and America remains a low performing nation. Nevertheless if this is what getting an F on the Ravitch report card looks like, what can we do to get an F minus minus?


Between the Promise of his greener days and these he masters now

March 21, 2016

(Guest Post by Matthew Ladner)

So I was looking at the National Alliance for Public Charter Schools Dashboard on state charter school sectors trying to figure out how the Arizona Charter sector managed to put it all together to rock the 2015 NAEP like a rock star on an epic hotel room thrashing bender. Just as a reminder, Arizona has long been known as a Wild West of charter schooling- liberal authorizing, relatively light-touch state oversight, etc. Just the sort of thing that a central planner hates. In addition, the sector is not generously funded by national standards, pulling in about $8k per student from all sources, and educates a majority-minority student body. Moreover the Credo analysis from a few years ago held its nose at AZ charter results. And yet, the 2015 NAEP comes in and shows AZ charter students scoring like a New England state in all four exams and these results are backed up by the state AZ Merit exam. What gives?

One possible factor- maturation:

AZ charter sector age

Paul Peterson noted years ago that the Credo analysis of charter test scores had not controlled for two potentially important factors- let’s call them shakedown cruise and transfer effects. Like any social enterprise, a school is unlikely to be at peak effectiveness in the early going.  In 2005-06 Arizona charter schools in years 1-3 outnumbered those that had been operating for 10 or more years three to one. Let the clock run a bit however and by 2013-14 old timers outnumber newbies by more than two to one. As far as transfer effects go, some brand new schools will have nothing but transfers, whereas established schools will typically be breaking in a new class of their youngest grade covered and some transfers. So we waited things out in Arizona and eventually we were rewarded with results like:

8m 2015 AZ Hispanic charter

Well AZ charters- you are growns up, you’re growns up and you’re growns up!

Next factor: churn.

The National Alliance for Public Charter Schools notes that between 2010-11 and 2014-15, 215 new charter schools opened. During the 2010-11 to 2013-14 period 96 Arizona charter schools closed. So factoring in life cycle performance, those 215 that opened may have looked pretty meh when Credo checked in on them as youngsters, but perhaps they were just out having an ale with Falstaff and the gang figuring a few things out getting their sea-legs under them as young organizations.

Let’s assume further that those 96 schools that closed actually were worse than meh on average. Arizona grants 15 year charters, so the oldest of the lot did not start coming up for renewal from the Arizona State Charter School Board until 2010. Charters of course sometimes close due to factors other than state action as well, and academically fantastic schools will be greatly under-represented in this subset. So you open about twice as many schools as you close over the last few years but the ones you open are sorting things out and getting better, while the ones you closed just couldn’t cut it results in:

Florida’s charter sector also rocked the 2015 NAEP. How much did they rock the 2015 NAEP you ask? Well this much:

Hey it’s cute Vermont almost tied Florida charter schools on the reading NAEP, especially since they are 92% Anglo and spend $15,500 per kid. Florida charters btw: 76% minority student body. I’m not going to look up the spending number but it is far less than $15,500. How’s that for closing the achievement gap? If you don’t believe it go and run the numbers for yourself here.

Florida charters seem to be doing something right. Possible maturation factor here as well? I’ll take “Sure Looks that Way to Me” for a thousand Alex:

Florida charter schools age

The National Alliance shows about 300 new charters opening and 101 closing in Florida in recent years. You let parents pick schools that are good fits for their kids, open a new bunch of schools on their way to improving, and close sub-meh, guess what your majority minority sector can rock the NAEP like a New England state.

Now not every charter sector, even among the long-standing ones, sees these kind of results. Many factors can and will influence such scores besides those discussed here. For instance, Michigan charter schools look pretty bad at first blush, but a concentration in Detroit may have something to do with that. The ability to slice and dice the NAEP data has definite limits and multiple factors can be simultaneously at play.  Minnesota however has the nation’s oldest charter law and seems to notably lack the sort of grand-slam ability of the Arizona, Colorado and Florida sectors. A lack of dynamism may be contributing while the average age of Minnesota charter schools has increased, very few new schools have been opening, and very few established schools closing- almost as though charters have their little niche but have been safely contained.

Last month Neerav asked “Is School Supply F***ing Everything?” Maybe so. Keep those new schools coming, let parents sort them out, and if parents don’t torpedo the low-performers don’t renew their charters. Otherwise sit back and enjoy!


Please Check the Scoreboard

March 16, 2016

(Guest Post by Matthew Ladner)

The Arizona Republic ran the following LTE from your favorite bearded wonk today. Okay, okay…fourth or fifth favorite…geez…

Linda Valdez (“How school choice sabotages Latino kids“) asserted that Arizona’s school choice options have been undermining the education of Hispanic students attending district schools.

This assertion cannot, however, withstand scrutiny. The National Assessment of Educational Progress shows that Arizona Hispanic students have made large academic gains.

Since all states began participating in NAEP in 2003, Arizona Hispanic students tied for first for the highest Hispanic on eighth-grade math, third among states in eighth-grade reading gains. Arizona Hispanic students tied for 6th in fourth-grade math and reading gains.

Arizona charter schools have more than done their part with a majority-minority student population and gains above and beyond the statewide average. Arizona Hispanic students attending charter schools, for instance, tied the statewide average for Delaware on eighth-grade math in 2015 on NAEP.

We have ample reason to desire a faster rate of progress, and I agree with Valdez that Arizona’s future rests heavily upon the success of Hispanic students. District schools, however, remain the most generously funded of Arizona’s school options by a wide margin and outcomes for Hispanic students have been trending in a positive direction.


Arizona charter students ROCK NAEP 4th grade math as well

October 29, 2015

(Guest Post by Matthew Ladner)

Well just to keep anyone from saying “oh yeah- but he didn’t show us 4th grade math!”

AZ charter schools 2015 NAEP 4m

My reaction:

and


So while they were at it Arizona Charter Students Rocked the NAEP 8th grade math exam too

October 29, 2015


(Guest Post by Matthew Ladner)

AZ Charter 2015 NAEP 8m

So we may be able to rule out the weird sample theory since NAEP has different random student samples for each test. On 8th grade math AZ charter school students scored in a statistical dead heat with Massachusetts. While there certainly is a self-selection factor in terms of parents applying for charter schools, I can tell you that every way I found to break the above numbers down shows a charter school advantage- charters scored better among low-income kids, and among middle/high income kids. They scored higher among Anglo kids and among Hispanic kids. Because charter school students only make up 17% of the student body, the NAEP data can only go so far in slicing and dicing data.

The point isn’t that self-selection had nothing to do with these results-they obviously did although we have a growing mountain of random assignment data from around the country that shows admission lottery winners outperform lottery losers. The most important points- first tens of thousands of Arizona parents sit on the outside looking in at charter school spots. Second- both district and charter results have improved in Arizona through a very difficult period of funding cuts for both sectors.

Congratulations to all of Arizona’s long suffering educators and leaders. We’re not there yet, but we are on our way.


BOOOOM! AZ charter schools RAWK the 2015 NAEP

October 28, 2015

(Guest Post by Matthew Ladner)

Arizona did well in the 2015 NAEP- up in three of the four tests and notched our first ever above the national average score in any of the four exams. This is all good news, and the gains look more impressive if you compare them to when the economy hummed and spending per pupil was relatively high (2007) to when not so much yet (2015). Sweet are the uses of adversity if surely very difficult for educators and administrators.

I ran numbers for charter vs. non-charter and tried to get closer to apples to apples by examining the scores of general ed students who qualify for a free or reduced lunch. If your story is that the charter schools have a nefarious plot to siphon off all the rich kids from North Scottsdale (good luck btw) these are not those kids.

AZ charter NAEP 2015

Some of the really big gains on the charter side here may be explained by an unusual bad showing for charter schools in 2013-and that could relate to the vagaries of NAEP sampling. Nevertheless they are way up from the good ole days of property bubble prosperity as well as from 2013 among both districts and charters- and the most important gains are the blue ones since they still educate 83% of the kids.

So that’s what you get for you “wild west” charter sector that routinely derided by overly cautious types who have no experience with coping with rapid enrollment growth- rocking academic gains for disadvantaged kids! Arizona still has far to go but…


The Age of (Relative) Efficiency and/or Austerity: It’s Already Started

September 16, 2015

(Guest Post by Matthew Ladner)

The early 1980s punk rock band Fear famously destroyed the set of Saturday Night Live (the gif above is from their SNL performance-SNL’s invitation to Fear to perform and bring some fans having been one of the greatest really terrible decisions of all time). In any case, Fear had a song called Let’s Have a War. Like most punk bands of the era Fear was out to frighten the parents of 15 year olds and draw attention to themselves with outrageous antics. The lyrics of Let’s Have a War (not to be confused with another Fear classic Bomb the Russians) as I recall went something along the lines of:

Let’s Have a War!

Jack up the Dow Jones!

Let’s Have a War!

It can start in New Jersey!

Ok Ladner where are you going with this? Right, so a refrain in the song:

It’s Already Started!

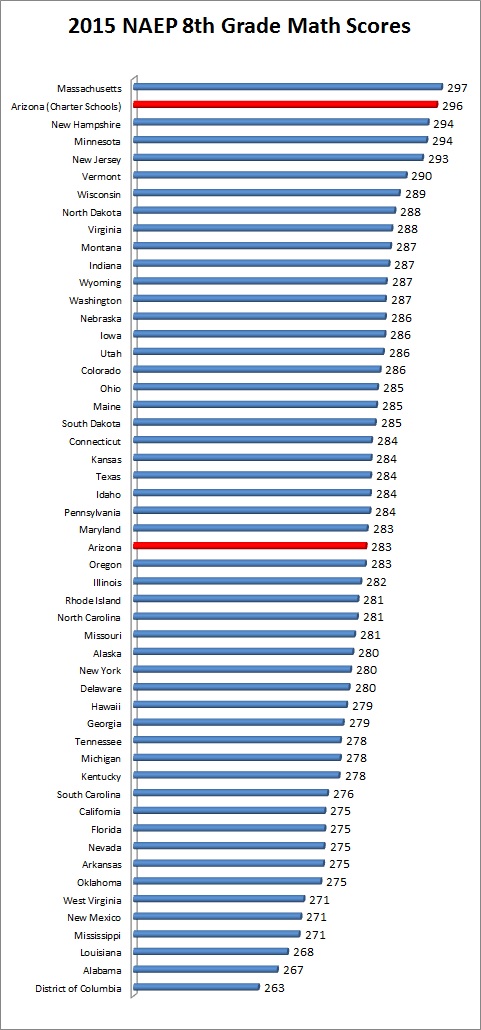
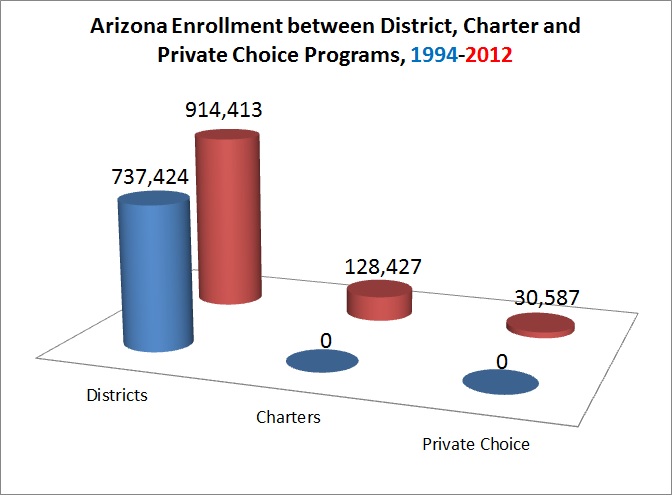
So out here in the Arizona cactus patch, the looming age of (relative) financial austerity and efficiency has already started. The people who work in the school system feel very grouchy about it, but where things stand today is much better than the recent past.

AZ NAEP

So let’s go back to the world of 1992 Arizona (blue columns). Arizona operated as a high-tax state in those days and the school districts were almost the only game in town (Arizona has always had a low rate of private school attendance).  The state had a majority Anglo K-12 population in those days, but unfortunately those Arizona Anglo students weren’t terribly skilled on average at reading English. Now mind you, they had proficiency rates 2.8 times higher than Arizona’s Hispanic student population at the time, but that provides little comfort.

What does this translate to today, in 2015, now that the class of 2000 have aged into the prime working years of their mid 30s? Let’s just say that many firms find it necessary to recruit nationally when searching for job candidates. No one was hoping for an overall reading proficiency rate in the low 20s in 1992, but we got it anyway.

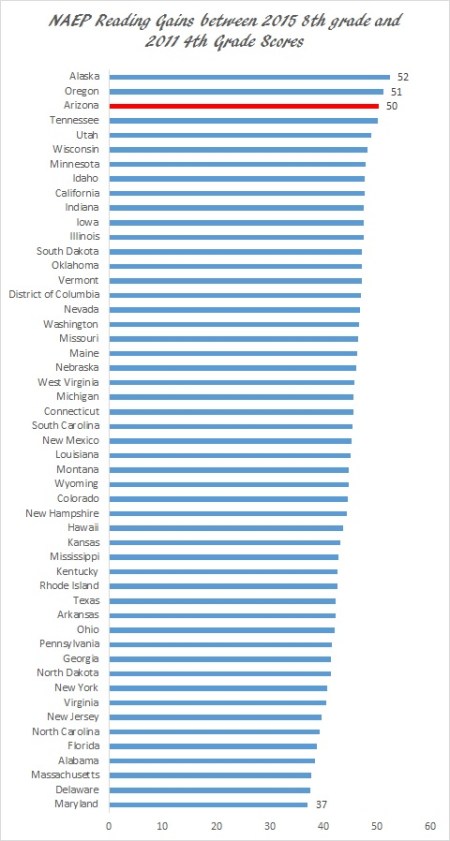
Now let’s look at the 4th grade reading scores for the Class of 2021 (red columns). While these results leave a great deal to be desired, they are profoundly improved over the 1992 4th grade results. Arizona closed the gap for Anglo students with the national average, but failed to do so with Hispanic students.

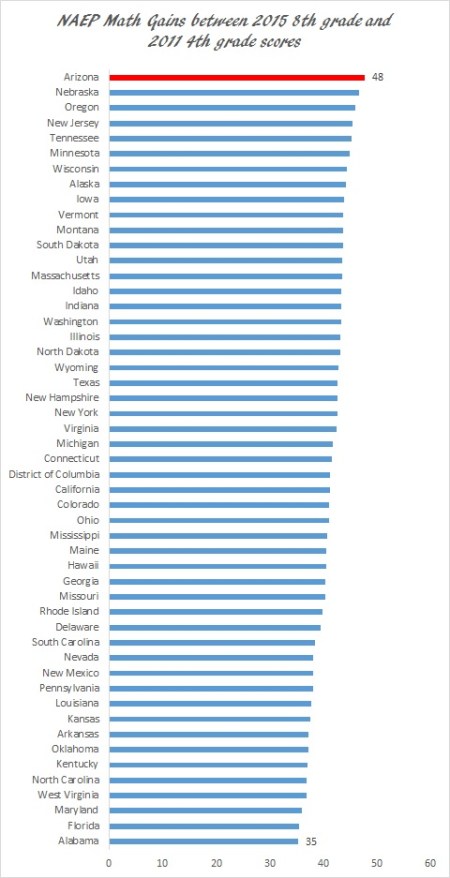
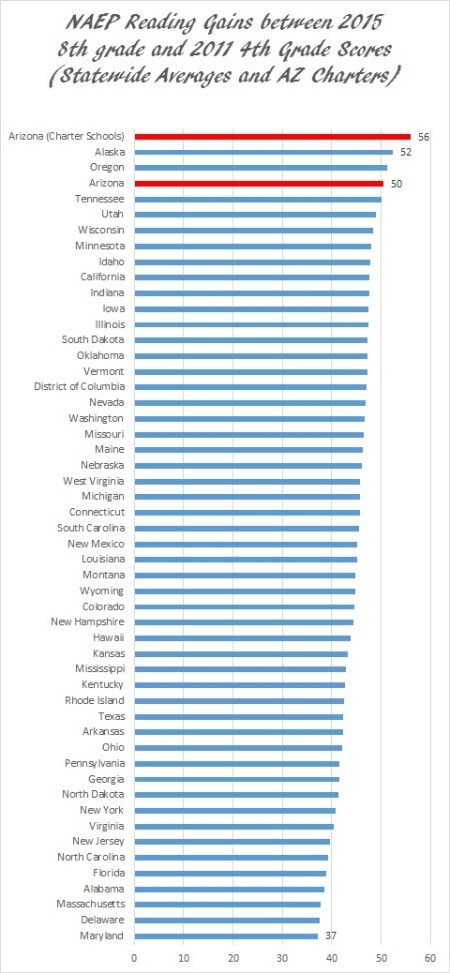
Hispanics now constitute a plurality of Arizona K-12 students. A 17% reading proficiency rate constitutes a looming catastrophe for the Arizona of 2030 and beyond. Thus while we should recognize the fact that Arizona’s academic outcomes have improved greatly, we should also recognize that the state has a desperate need for still greater gains. Note however that all of those nasty policies that Diane Ravitch hates: standardized testing, charter schools, private school choice, etc. all started phasing in around 1994 in Arizona, and that the 2013 NAEP had the highest average scores in state history despite funding cuts and a large transition in student demographics. This does not constitute final glorious victory, but certainly progress.

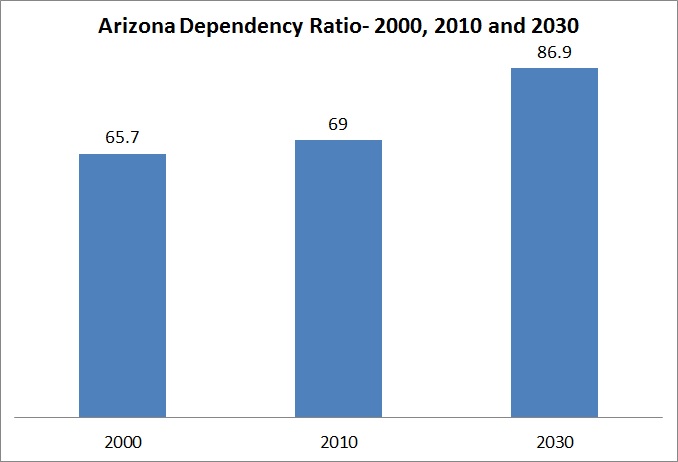
Arizona is a relatively poor state with an unusually small working age population (lots of old retirees and young kids). Rapidly growing states tend to rank towards the bottom of state rankings of per pupil funding, and will do all the more so if lots of the state has either retired or is still in school. Arizona does have a large number of wealthy retirees, but let’s just say that many of them have other residences in addition to their get out of the cold spot, and this means they have the opportunity to avoid paying Arizona income tax.

The Great Recession was an elbow in the face to Arizona’s housing dependent economy followed by a swift kick to the head. (To you non-Gen X readers this is mosh-pit imagery consistent with the punk rock theme of this blog post). Once the federal stimulus money ran out real declines in per-pupil spending commenced. This document from JLBC shows that the inflation adjusted spending per pupil in the Arizona public school system dropped from $9,438 in 2007 to $7828 in 2014. 

Outrageous! Horrible! Get a rope!

Slow down on the lynch mob. The 2007 number basically represented the height of the property bubble and all of the funny money that it brought flowing into state coffers. Arizona had spent far less than that per pupil in the past, and the height of a bubble does not make for a good mental entitlement point. When the state had money, it increased K-12 spending. There has been joy before, there may be joy again, but the state can’t spend money it doesn’t have.

Of course we could raise taxes. This however is governed by a little thing called democracy. We had a governor’s election in 2014. One candidate promised to balance the state’s spending and revenues without raising taxes. The other claimed that he would not raise taxes but also campaigned on increasing K-12 spending. Arizona elected candidate A (Doug Ducey) by an overwhelming margin. A few years earlier, the school district industrial lobbying complex put a painfully convoluted ballot proposition to increase taxes for education spending on the ballot. The public rejected it by a huge margin. We have regular elections for state legislature. The voters have continued to elect a pretty conservative bunch and well, they had other options available to them.

Arizona voters did endorse a sales tax increase almost a decade and a half ago to increase the state’s base funding amount to inflation. The interpretation of this provision is currently a matter of legal dispute between the legislature and the industrial complex, but the resolution seems unlikely to result in a game changing amount of funding regardless of the outcome. Arizona doesn’t have a game changing amount of money to give to schools within the tax structure that voters have both explicitly and implicitly endorsed.

More importantly, Arizona’s 2013 NAEP scores were not only higher than 1992- they were higher than 2007. Between 2007 and 2013 Arizona NAEP trends: 8 point gain in 4th grade math, four point gain in 8th grade math, three-point gain in 4th grade reading, five point gain in 8th grade reading.  The proper term to describe an increase in outputs with decreased inputs: efficiency gain.

The folks working in the schools feel very grouchy. Unlike the risible bellyaching before the onset of the Great Recession (when spending increased and everyone had enrollment growth) they have a much more serious case to make in the current context. Running a school district in Arizona right about now is not an easy task- your per pupil funding has declined and your student count is more likely than not to be dropping. Tough decisions lie ahead on a worryingly large number of half-empty district facilities. You are having a tough time finding teachers as your Baby Boomers retire.

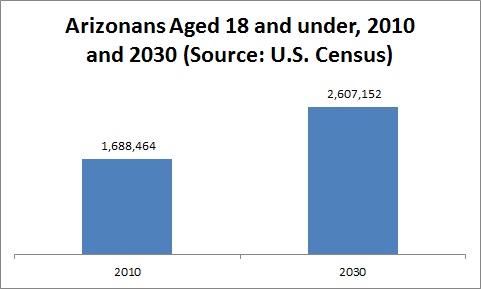
It’s already started in Arizona. Currently we are in year 5 of what you can either view as an age of austerity, or an era of improving efficiency depending on whether you view matters through a provider or a taxpayer lens. The Census Bureau projects large increases in Arizona’s youth and elderly populations over the next 15 years.

It’s not likely to get any easier. Arizona’s need for more effective and cost effective education delivery will continue to grow over time regardless of how much we choose to lament the need for change.


Destruction of Public Education or Pressure Release Valve? You Make the Call…

February 16, 2015

AZ enrollment trends

(Guest Post by Matthew Ladner)

This is what the “destruction of public education” looks like in extremist, wild west Arizona…oh….wait…what? The increase in district enrollment is greater than the growth in charter school students since the creation of the law charter law in 1994 and 2012-176,989 to 128,427?

Yeah, but…

What is that you say? Even if you combine all of Arizona’s private choice students with all the charter school students, the increase in district enrollment still outstrips the increase in choice enrollment 176,989 to 159,014?

Ok but if those choice programs didn’t exist, the number of students and the amount of money going to districts would be higher than it is now. So…

High demand schools surrounded by portable buildings? C’mon that would never happen! Already common in Texas? Arizona has been broke since 2007, unable to afford much new district building space eh? Well we could just raise taxes…what? Arizonans raise millions of private dollars to finance charter and private school spaces? Census Bureau projects hundreds of thousands more students over the next 15 years? Already high elderly population set to vastly expand too?

Ok, sign me up.


Arizonapocalypse

November 19, 2013

(Guest Post by Matthew Ladner)

Last week the Arizona Board of Regents released a report detailing the catastrophic failure of Arizona high-schools in preparing students for higher education.  Specifically the report traced the high school class of 2006, finding that half of the high-schools had five percent or less of students finishing higher education degrees or certificates within six years.  A mere 40 of the almost 460 schools produced 61% of Bachelor degrees in the AZ Class of 2006.

So, the news could have been much better. Here is the next shoe to drop- things are going to be getting increasingly more difficult in the years ahead.

The United States Census has produced population projections by state. Let’s see what the future has in store for Arizona. First a little context. Arizona’s current population is was about 6.5 million in 2012.

First challenge- a very large increase in the youth population.

Arizona Under 18

The Census Bureau projects a large year by year increase in young people.  The Census has projections for the 18 and under population, and also for the 5-17 population.  The 0-3 population is generally outside of the pre-school and K-12 system, meaning that the 18 and under population overstates the impact that the increase in the youth population will have on the state budget in 2030.  The 5-17 year old figure understates the situation due to 4 and 18-year-old students who will receive either preschool or K-12 assistance.

The next chart uses the Census Bureau’s projection for the increase in the 5-17 year old Arizona population, and puts it into context by comparing it to the size of the charter school and private choice populations of Arizona.  Arizona’s charter school law passed in 1994, and the scholarship tax credit program passed in 1997. The time between then and now is roughly comparable with the time span between now and 2030.

Arizona 5-17

Arizona school district enrollment is set to expand regardless of what we do on the parental choice front, just as it has for the last two decades. In the last two decades, the charter school law has produced a large number of those 40 schools that produced 61% of the BA degrees. In combination with the scholarship tax credit programs and the still nascent ESA program, they have taken the edge off of district enrollment growth in the aggregate.

Arizona does have high-quality charter operators who will continue to slowly but sure increase the islands of quality.  If the ESA program survives court challenge it may allow for a quicker pace of private choice expansion than the tax credit program. Creative destruction of the sort that might actually close dysfunctional schools, other than charters that fail to launch, is simply not in the cards.  The districts full of those 5% and under high schools will be going into the debt markets to build more dropout factories.

Or perhaps they will be running double shifts at the current dropout factories, as it will become increasingly difficult to finance new construction.

At precisely the same time Arizona will be dealing with a surge in the youth population, an even larger problem looms the growth in the elderly population. Again from the Census projections:

Arizona Elderly

For those of you squinting to read the numbers, that is an increase from 922,000 65+ year olds in 2010 to almost 2.4 million in 2030.

So let’s sum up the story so far- Arizona’s K-12 system currently does a very poor job in educating anything more than a thin slice of students.  Arizona has a vast increase in students on the way to coincide with an even larger increase in the elderly population.  Still with me? Okay, let’s keep going.

Demographers calculate age dependency ratios, and economists have found that they predict rates of economic growth. An age dependency ratio essentially compares the number of young and elderly people in a population to the number of working age residents. The logic behind the notion is that young people require a heavy investment in social services (primarily education) while the old also require a heavy investment (primarily in the form of health care and social insurance retirement benefits).  From the perspective of a state budgeting agency, young people don’t work, don’t pay taxes, and go to school. Older people are out of the prime earning years, often heavily use Medicaid. An age dependency ratio basically tells reveals the number of people in the young/old categories compared the number of people in neither category (i.e. people of typical working age).

The United States Census Bureau calculates an Age Dependency Ratio by adding the number of people aged 18 and under to the number of 65 and older and dividing it by the number of people aged 19 to 64. They then multiply the figure by 100 just to make things tidy. The formula looks like:

Age Dependency Ratio = ((Young + Old)/(Working Age)) * 100

Many people continue to work and pay taxes past the age of 65, making it inappropriate to view them as “dependent.” It is also the case however that many people above the age of 19 are still in school and thus are not yet working and/or paying much in the way of taxes. We all probably know hyper-productive 70 year olds and people in their 20s engaged in a six-year taxpayer subsidized odyssey of self-discovery that will not number “graduation” among an otherwise wonderful set of experiences. During periods of prolonged economic difficulties, moreover, it is obviously the case that lower rates of working age people will in fact be working, and thus making taxes.

Notwithstanding these important caveats, the broad idea behind age dependency ratios is to roughly assess the number of people riding in the cart compared to the number pulling the cart at any given time. People of course both benefit and pay into these programs at different stages of life, but the current ratios serve as a measure of societal strain.  What does the age dependency ratio for Arizona look like?

Arizona Age Dependency Ratio

Note that Arizona’s age dependency ratio in 2010 was already among the highest in the country. A social welfare state with 86 people riding in the cart for every 100 pushing it will not compute. In 2030, the Class of 2006 will be squarely among those expected to push the cart of the Arizona social welfare state.  How alarming and unfortunate then that many of them dropped out of high-school, and many more of them dropped out of college. The most immediate way Arizona can help address the looming crisis of 2030 is to get more students educated now.

I’m not sure how this plays out. I am certain that we have been thinking too small given the size of our challenges.


Creative Destruction in Public Schooling

March 9, 2009

(Guest Post by Matthew Ladner)

The Center for Education Reform released The Accountability Report – Charter Schools today. Lots of interesting information about the state of the charter schooling movement, including state by state information. For example, my state of Arizona has 510 charter schools operating, but since the charter law passed here in 1994, 96 Arizona charter schools have closed.

I suspect that some of those 96 schools never actually opened, but that is okay. Let’s face it, there are district schools we wish we had never had open as well, based on their long track records of abysmal test scores.

One out of five new school closing may not be the cold howling wind of the market for restaurants, but it is something. Creative destruction and competition for students provides focus, which helps to explain why 9 out of the top 10 public high schools, as ranked by their reading scores, in the greater Phoenix area are charter schools. Check it out for yourself here.

Plenty of interesting information in the report, well worth a look.

UPDATE: Kara Hornung Kerwin of CER, the first and only woman to ever have a bachlorette party thrown on her behalf by a group of education policy geeks in Jackson Hole Wyoming, wrote me to say that in fact all 96 of those schools opened and closed. The school market is a bit more savage than I thought.

Notice the titles here and with the recent Fordham Report on standardized testing. The Accountability Report-Charter Schools vs. The Accountability Illusion.

Things that make you go hmmmmm…..