Derek Jeter for “The Higgy”

April 5, 2018

Image result for marlins "The Great Sea Race"

It was bad enough that Marlins fans had to suffer under previous team owner Jeff Loria’s inept management of the team (after impressively winning the World Series twice in the first ten years of the team’s existence).  And it’s even worse that a new ownership group led by former Yankee star, Derek Jeter, has dismantled what may have been the best outfield in baseball to conserve cash since the new owners seem financially exhausted immediately after having made the purchase. But the action that has significantly detracted from the human condition and made Jeter worthy of a nomination for the William Higinbotham Inhumanitarian Award is his decision to cancel The Great Sea Race.

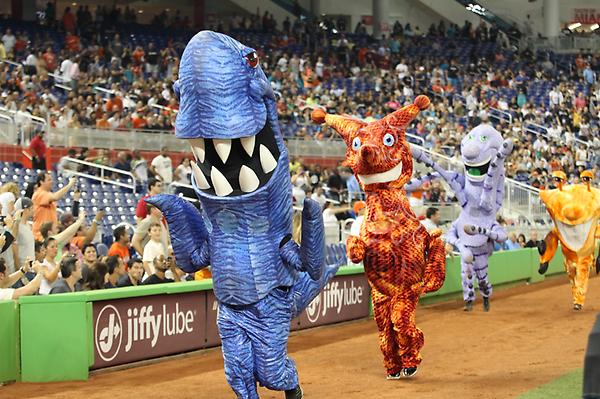
Since 2012 the Marlins have held a race among mascots dressed in sea creature outfits during the 6th inning of home games.  This contest between Bob the Shark, Julio the Octopus, Angel the Stone Crab, and Spike the Sea Dragon, however, has come to a halt under the new ownership led by Jeter.  The exact reasons have not been given, but it appears that the new ownership group seems to view baseball as a serious enterprise, deserving of reverence.  As one commentator put it: “[Jeter] doesn’t want fans to have anything to smile about this year.”

The late, great Bill Veeck understood what baseball was really about — fun.  As owner of the Cleveland Indians, St. Louis Browns, and Chicago White Sox he packed the games with bread and circuses to make the experience entertaining.  He hired Max Patkin, the “Clown Price of Baseball,” to coach the Indians.  Patkin “had a face seemingly made of rubber that could make many shapes. He was rail thin and wore a baggy uniform with a question mark (?) on the back in place of a number, and a ballcap that was always askew. While some derided his act as corny, he became a beloved figure in baseball circles…”

In St. Louis, “some of Veeck’s most memorable publicity stunts occurred during his tenure with the Browns, including the appearance on August 19, 1951, by Eddie Gaedel, who stood 3 feet 7 inches tall and is the shortest person to appear in a Major League Baseball game. Veeck sent Gaedel to pinch hit in the bottom of the first of the game. Wearing elf like shoes and ‘1/8’ as his uniform number, Gaedel was walked on four straight pitches and then was pulled for a pinch runner.  Shortly afterwards ‘Grandstand Manager’s Day’ – involving Veeck, Connie Mack, and thousands of regular fans, enabled the crowd to vote on various in-game strategic decisions by holding up placards: the Browns won, 5–3, snapping a four-game losing streak.”

And in Chicago, Veeck was the first to introduce an electronic scoreboard that lit up, made noises, and shot fireworks when the White Sox hit a home run.  And in one of my greatest childhood memories, Veeck organized Disco Demolition Night, in which local DJ, Steve Dahl, dressed in a military uniform, drove a Jeep into center field, and blew up a pile of disco records during the middle of a double-header.  Dahl got the crowd so riled up that they stormed the field, causing enough damage that the White Sox had to forfeit the second game.  It was hilarious!  Veeck was also the one to convince Harry Caray, who was the announcer for the White Sox at that time, to sing “Take Me Out to the Ballgame” to the crowd during the 7th inning stretch.  Caray tried to refuse but Veeck said that he had a recording of Caray singing and would play it over the audio if Caray refused to perform it live.  Caray continued this practice of singing to the crowd when he moved to the Northside to become the announcer for the Cubs.  Thus was a much-loved baseball tradition born.

Veeck’s teams also played very well.  Under Veeck’s leadership, the Indians won their first pennant in 20 years in 1948.  In 1959, Veeck’s White Sox won their first pennant in 40 years. But Veeck understood that most teams fall short most years, so they have to offer their fans something other than victory to keep everyone entertained.  Yes, they should offer quality play, but sometimes even that is beyond the reach of most teams.  As we Marlins fans (can I use the plural for that?) wait for the team to rebuild with only moderate chances of being successful for many years, can’t we at least watch some frickin’ fish run around the outfield?

Jeter seems to represent the type of baseball fan who has watched Field of Dreams a few too many times.  The game is not a sacred ritual, deserving of church-like propriety.  It’s entertainment. It should be fun. For trying to make us all eat our baseball vegetables and taking away The Great Sea Race, Derek Jeter is worthy of The Higgy.


Hess and Gallo Get Words Wrong in NRO

April 4, 2018

Logomachy

(Guest post by Greg Forster)

In NRO today, Rick Hess and Sofia Gallo accuse the school choice movement of using “overheated” and “alarmist” rhetoric. They assert that since school choice is the opposite of neighborhood schooling (which all smart people know to be true, since we say it and we’re the smart people), choice advocates need a new, toned-down rhetoric to convince jumpy soccer moms that choice is no big deal and won’t have any big effects on anything.

How is this wrong? Let me count the ways:

1) “School choice advocates are wild-eyed ideological extremists” is a timeworn smear used by the Blob to demonize reformers, and anyone paying attention should have seen through it by now. For Hess and Gallo to resort to this lazy stereotype is offensive. The examples they bring to justify their claim that choice advocates are overheated and alarmist (choice is like Uber for schools!) redefine the whole concept of “weak tea.”

It is Hess and Gallo whose rhetoric is overheated and alarmist, in claiming that choice advocates are overheated and alarmist.

2) Hess and Gallo admit that choice is not only increasingly successful politically, it is growing more popular over time. Their efforts to create the impression that choice has a public perception problem (choice underperforms when compared to pie-in-the-sky hypothetical utopian alternatives in heavily biased survey questions formulated by the servants of the Blob at PDK!) don’t change the basic facts.

By Hess and Gallo’s own showing, choice is winning in statehouses, winning in governors’ mansions, and winning in public opinion polls. No doubt that success will ebb and flow in the future, as it has in the past. But choice has better public perception today than at any time in its history.

3) School choice is not in tension with local control, it is local control. For half a century, governance of district schools has moved further and further out of the local neighborhood and up the bureaucratic ladder, from the building to the district to the state and federal levels. There is no plausible plan for reversing that movement, other than school choice.

The only possible future of “neighborhood schools” is neighborhood schools of choice. Nothing else but choice will return governance of schools to the neighborhood level.

Because guess what neighborhoods are made up of? Parents. And parents who are given school choice exercise that choice as members of their local communities, gathering information and forming relationships in neighborhoods.

4) Parents tend to like their own schools, so Hess and Gallo recommend that choice advocates adopt a message along the lines of “choice won’t change schools.” Because that’s how you sell a reform – argue that it doesn’t matter and won’t change anything.

Or perhaps the message will be, “choice won’t change schools for people like you, it will only change schools for those other people. You know the ones we mean.”

Jay has been pointing out for years that the biggest mistake education reformers have been making is to argue that their policies will benefit a small and relatively powerless portion of the population, and offer no benefits to larger and more powerful constituencies. Hess and Gallo want choice to double down on that strategy.

5) To the extent that choice advocates could do better in framing their rhetoric, the problem is not that choice is percieved as a threat but that choice is percieved as of limited value because it is disconnected from moral imperatives like justice, equal opportunity, diversity and freedom. School choice advocates often assume that when they talk about markets they are affirming those imperatives, but in fact the language of markets does not and will not invoke those commitments for most people. A new language of school accountability through choice is needed to connect school choice to the things that matter most.

We shouldn’t talk as if choice should matter less, but as if it should matter more. Because it does.


Museums and Theaters Should Stop Telling Me What to Think About Art

April 3, 2018

Image result for “Perhaps only silence and love do justice to a great work of art”

Museums and theaters should stop telling me what to think about art.  I know that the folks who run museums and theaters think they are just providing context and facilitating discussion, but too often they are actually attempting to control what their patrons think about art works and plays with excessive gallery text and after show “talkbacks.”

I have no expertise in curating galleries or presenting plays, but I can speak as a frequent consumer of the arts that this well-intentioned, but ultimately bossy, deluge of information interferes with my direct experience and enjoyment of the art.  And I’m not the only one who feels this way.  Last year the playwright, David Mamet, forbid talkbacks following his plays.  He was mocked by some in the theater community for this, but I understand what drove his action.  Too many theaters were hosting talkbacks after his plays in which the theater staff or an expert they selected were obviously steering the audience toward particular and simplified interpretations of his work that might make it less controversial.  As another playwright, Christopher Shinn put it: “Broadly speaking, theaters use talkbacks to protect the audience from uncomfortable feelings the play may have aroused.”

I’m all for discussing plays after you see them, but that’s why you should go for dinner or drinks afterwards. When theaters host the discussion they cannot help but use their authority to drive the discussion in certain directions.  I don’t want my theater to tell me what to think about the play I just saw.  I want to develop my own thoughts and talk to others without the mediation of self-appointed experts on its meaning.

Shaping what people think about a play is especially likely if the theater-facilitated discussion immediately follows the performance.  That’s why some theaters hold events at separate time or in separate locations, more clearly demarcating the interpretation from the performance itself.  This seems like a reasonable compromise for theaters concerned about expanding audience engagement without being too controlling.

Some art museums have also drifted away from excessive gallery text.  The Isabella Stewart Gardner museum in Boston, for example emphasizes: “Isabella created her installations to evoke an emotional response in visitors. That’s why, unlike at other institutions, there aren’t conventional labels in this museum. She wanted you to find your own meanings.”  But other museums, while trying to avoid “the priestly voice of absolute authority,” still feel obliged to cover their walls in verbiage about the social and historical context of the works they display.

I sympathize with the impulses of museum staff to try to help their patrons, but I fear that they have too little trust in the ability of the art to communicate without mediation.  In addition, social and historical contexts are complicated and often disputed, so when museums try to convey that context they are inevitably making choices about what the correct understanding of history and sociology should be.  I am no more interested in having my museum tell me what to think about the world than having it tell me what to think about art.


Also posted on the University of Arkansas’ NEA Research Lab Blog.


The Pre-Spinning of NAEP Results

April 2, 2018

Image result for spinning

NAEP results are being released next week, but state departments of education have already been briefed on their results.  State education officials are leaking like sieves, so many edu-pundits have at least some inkling of what’s coming.  Rumors from multiple sources suggest that the results generally look bad — with a decline nationally.  Aware that they may be blamed for declines, a number of folks are anticipating the release by placing their own spin on the soon-to-be-released results.

Exhibit A in this pre-spinning is John White, who is the superintendent of education in Lousiana.  According to Matt Barnum at Chalkbeat White sent a letter to the U.S. Department of Education on March 23 raising concerns about the comparability of NAEP results over time given the transition to computer-administered testing.  Although he acknowledges that NCES made adjustments to ensure the comparability of paper and pencil and computer administered tests and found insignificant differential effects by sub-group, White still raises questions about whether differential effects may distort results for certain states.  Barnum notes: “Even though researchers warn that it is inappropriate to judge specific policies by raw NAEP results, if White’s letter is a signal that Louisiana’s scores have fallen, that could deal a blow to his controversial tenure, where he’s pushed for vouchers and charter schools, the Common Core, letter grades for schools, and an overhaul of curriculum.  White said his state’s results are not what’s driving his concerns.”  Hmmm.  Maybe it’s just a remarkable coincidence that White has suddenly developed these technical concerns about the validity of NAEP at about the same time that he was briefed on his state’s results.  How much do you want to bet that there is a decline in LA?

Exhibit B is Arne Duncan taking to the pages of the Washington Post to defend the idea that ed reform has contributed to significant improvement.  He focuses on trends over the last few decades.  That would be a smart move to focus on long-term gains if recent trends — you know, in the wake of Duncan’s tenure as U.S. Secretary of Education — have been taking a nose-dive.  NAEP results slipped for the first time when 2015 results were released.  How much do you want to bet that national results have declined again?

Barnum is right to warn people away from inferring too much from changes in NAEP as an indicator of the success of any particular policy or education leader, but these folks live in a political, not a research, world.  Both White and Duncan’s political standing in education policy was built on over-claiming from NAEP results, and those who live by the NAEP sword may die by it.  That’s why they better start spinning.


Nominate a Deserving Fool for the Higgy

April 1, 2018

untitled

(Guest post by Greg Forster)

Ah, yes, it’s once again that magical time of year when a young man’s thoughts turn to fools. I refer of course to The Higgy – the William Higinbotham Inhumanitarian of the Year Award. For the next two weeks, we’ll highlight our (un)favorite inhumanitarians; please join the fun and submit your nominations by email or comment! This year’s most (un)deserving nominee will be (dis)favored with The Higgy on Tax Day, April 15.

The award is named for history’s greatest monster, William Higinbotham.

For reference, here once again are the official criteria for selecting the winner:

“The Higgy” will not identify the worst person in the world, just as “The Al” does not recognize the best.  Instead, “The Higgy” will highlight individuals whose arrogant delusions of shaping the world to meet their own will outweigh the positive qualities they possess.

In other words, we’re looking for PLDD not BSDD.

In that spirit, I’m nominating pointy-headed academic and bloviating edu-blogger Jay P. Greene for The Higgy this year. His arrogant delusions of shaping the world include endorsing Common Coreunion corruption, communism and even slavery. Last year, though, he went too far – he took all the fun out of The Higgy by giving it to Plato. He said the Republic could earn The Higgy even if it was actually a satire of irresponsible utopianism. Well, guess who else writes satires of irresponsible utopianism!

April Fool’s, of course! My real nominee will be coming in the next few weeks – as, I hope, will yours. May the best fool win!


Did Changed Test Questions Cause National Decline in Smarter Balanced Scores?

March 26, 2018

(Guest Post by By Douglas J. McRae and Williamson M. Evers)

Did Smarter Balanced mishandle the bank of test-questions for 2017? Test scores dropped in virtually all states using Smarter Balanced national tests in their statewide testing programs in 2017.

States that used the Common Core-aligned Smarter Balanced tests showed English/Language Arts and Mathematics composite declines for 11 of the 14 states using these tests spring 2017, neither a loss nor a gain for 2 states, and a very modest gain for only a single state. Looking only at E/LA scores, there are declines for 13 states and only a tiny fraction of one percent gain for one state.

Tony Alpert, executive director for the Smarter Balanced Assessment Consortium, argues these results show that scores from its states are on a plateau. No, instead, there has been a substantial consortium-wide decline in scores.

We can compare the 2017 declines to consortium-wide composite score gains for 13 out of 14 Smarter Balanced states in 2016, and to composite gains for the parallel PARCC consortium for 2017 for all except one state. Both of these comparisons make the 2017 Smarter Balanced declines look like a sore thumb pointed downwards.

Yet Smarter Balanced continues to stonewall against releasing actual evidence or independent analysis of data contributing to the 2017 declines in test scores.

Alpert’s Jan. 26 opinion piece acknowledged for the first time that the 2017 item bank was changed from the 2016 item bank in a significant way. All information released by Smarter Balanced prior to Jan 26 indicated that the 2016 item bank was unchanged from 2015, and there was no public notice that the 2017 item bank was in fact modified from the 2016 item bank.  This lack of transparency from Smarter Balanced adds to concerns that the 2017 declines may be traced to changes for the 2017 test-question bank.

Alpert says that the item bank was “similar between the two years.” Well, “similar” isn’t good enough for valid, reliable gain-scores from year-to-year or trend data over multiple years — certainly one of the major goals for any K-12 large-scale statewide testing program. We need more evidence than an assertion of similarity.

To generate valid reliable gain scores from year-to-year, a test maker has to document that changes made for any item bank do not change alignment to the academic content standards that are being measured, as well as not changing the coverage of what is in the blueprints for the test. In addition, the balance of easy-medium-hard test questions has to match the prior item bank, or scoring adjustments need to be made to reflect changes. This information has to be available before a modified item bank can be used for actual test administrations.

A glimpse into this information surfaced on Feb 9 in a document linked to an Education Week post on this issue. This link was to Smarter Balanced subcontractor (AIR) technical report dated Oct 2016 (but not made public by Smarter Balanced until recently). It includes an appendix on changes for item characteristics for Smarter Balanced operational item banks for 2016 and 2017; these charts showed the addition of more “easy” items for E/LA and Math for grades 3 and 4, and addition of more “hard” items for E/LA and Math for grades 5, 6, 7, and 8. This mix of additional items for the 2017 testing cycle indicates the 2017 item bank had more difficult items than the 2016 item bank, which unless Smarter Balanced adjusted their scoring specifications for the 2017 test, would be consistent with the decline in scores from 2016 to 2017 documented in late September 2017. Smarter Balanced has not released information to date on whether the scoring specifications were adjusted for differences in difficulty of the tests on a grade-by-grade basis for both E/LA and Math for the spring 2017 test administration cycle.

In addition, a test maker should monitor the item-by-item data for a revised item bank early during an actual test administration cycle to insure the new items added to the bank (for either replacing former items or expanding the size of the bank) are performing as anticipated, in order to further modify scoring rules as needed to ensure comparability of results from year-to-year. According to the Feb. 9 Education Week post, Smarter Balanced said they were now doing these analyses, long after-the-fact.

The Smarter Balanced lack of transparency for critical information on this issue is quite troubling. So far, Smarter Balanced has released no information confirming these routine test integrity activities were done prior to scoring and releasing spring 2017 test results for 5-6 million students from 14 states.  Smarter Balanced has the behind-closed-doors data from the 2017 testing cycle; those data are required for informing any changes for the 2018 testing cycle which is already underway. If the 2017 data does not inform changes for the 2018 testing cycle, lack of routine comparability activities will affect Smarter Balanced annual gain scores and trend data for years into the future.

If Smarter Balanced has the evidence outlined above to justify their claim “we have every reason to believe that the scores accurately describe what students knew and were able to do in spring 2017,” then the professional thing to do was to make that information available concurrent with the release of 2017 test results in the fall of 2017, with perhaps more comprehensive analyses released before the beginning of the next test administration cycle.

Such transparency would have informed students, teachers, parents, school & state administrators, state policy makers, the media, and the public of the integrity of previously released test results and would have offered justification for any changes for the upcoming testing cycle. More transparency from Smarter Balanced would also allow independent experts to review and validate their currently behind-closed-doors data. What is Smarter Balanced hiding? Why isn’t it transparent like any other professional testing organization?

We repeat our call for Smarter Balanced to open the wall of secrecy for the information needed to investigate their 2017 consortium-wide score decline problem, and allow their claims to be examined by independent experts. The Smarter Balanced January 29 opinion piece falls woefully short of providing evidence their 2017 tests provided comparable scores from year-to-year upon which to conduct gain and trend analyses. We deserve better analysis and explanations from Smarter Balanced, along with much greater transparency for all parties interested in statewide K-12 test results across the country.


Douglas J. McRae is a retired educational-measurement specialist from Monterey, California.  Williamson M. Evers is a research fellow at Stanford University’s Hoover Institution and a former U. S. Assistant Secretary of Education for Planning, Evaluation and Policy Development.


Yes, School Choice *Is* Local Control

March 21, 2018

homer-nodded

(Guest Post by Jason Bedrick)

Even Homer nods.

AEI’s Rick Hess and Andy Smarick both have well-earned reputations as thoughtful, insightful, and fair-minded scholars of education policy. However, in a recent piece for National Review highlighting the tension between local control and educational choice, I believe they missed the mark.

Before I get to where we disagree, I should note that I agree with most of what they wrote. Indeed, I think reformers would do well to heed the advice (and warnings) they offer at the end of their article. Choice is not a panacea, nor the be all and end all of education reform (though I do think it’s the most important element). Moreover, all policies, including educational choice, have tradeoffs. The benefits may far outweigh the costs, but there are costs, and advocates should acknowledge them.

However, Hess and Smarick are a bit too quick to dismiss the argument that the “most local of local control” is educational choice, and their description of the premises of the supposedly competing principles of choice and local control muddies more than it illuminates.

After noting the popularity of both district schooling and educational choice, the authors write:

Given its appeal, [choice] advocates have dismissed any potential conflict between choice and local control by blandly observing that parental choice is the “most local of local control.” As Education Secretary Betsy DeVos has put it, “the answer is local control. It’s listening to parents, and it’s giving more choices.” But this belies real tensions. After all, the local-district system is premised on tradition, continuity, and geography; choice on innovation, markets, and voluntary associations.

Bland or not, choice advocates are right to argue that the “most local of local control” is when the locus of control is parents, not elected officials and bureaucrats. Granted, as Hess and Smarick note, “local control” has “historically meant that an elected board oversees all public schools in a community,” and choice is in tension with the monopolistic system of local edu-bureaucracies. But choice advocates aren’t denying that. Rather, they’re exposing the reality that district schooling offers only the illusion of local control.

As Neal McCluskey has meticulously documented, our zero-sum political schooling system pits parents against each other. At best, majorities impose their will on minorities. But the reality is often even worse than that. As Terry Moe and others have shown, special interests have captured the public education system via low-turnout, off-cycle elections, collective bargaining, state and federal agency directives, and myriads of other means. The ability of parents to actually influence education policy is quite limited in this system.

Properly understood, as James Shuls has argued, local control means parents are in control of their children’s education:

De Tocqueville wrote long ago, “local assemblies of citizens constitute the strength of free nations.”  Unfortunately, our local institutions governing education have been weakening in recent decades.  On the other side of the Show-Me State, the recent school board elections in the Kansas City School District didn’t have a single name on the ballot. Only one candidate got the necessary number of signatures to run in the election and was thus automatically elected, and the three other seats had to be filled entirely by write-in candidates.

To turn a phrase of left wing activists around, is this what democracy looks like? Or, more pointedly for conservatives, what does local control mean in education today?

Local control is not simply a tyranny of the majority on a small scale. Local control, properly understood, means empowering families, those “little platoons” that another lover of local control, Edmund Burke, so valorized, to make the best educational decisions for their children. It means allowing local community organizations like nonprofits and churches to operate schools where students are free to use their state support to finance their education.  It means interpersonal networks within communities coming together to share information about what schools are doing, which ones are better than others, and where children might thrive.

In short, is has nothing to do with having a school board.

Hess and Smarick also go awry when they claim that “the local-district system is premised on tradition, continuity, and geography; choice on innovation, markets, and voluntary associations.” The reality is far more complex — so much so that their attempt at a such a clean distinction is more misleading than clarifying.

The district system is certainly about geography, and it’s also true that adults have a great deal of nostalgia about their childhood schools (and especially their sports teams), but when so many district schools are embracing the latest social justice fads (thanks in large part to ed schools),  it’s hard to claim that they’re premised on tradition and continuity.

And while choice advocates may talk too much about innovation and markets (mea culpa), the reality is that most parents participating in choice programs are choosing religious schools rooted in tradition, continuity, and community (my family included). Indeed, some of these schools predate our district school system — and even the nation itself.

Again, I think Hess and Smarick get a lot more right than they get wrong. Their thought-provoking article is definitely worth reading in full, especially by advocates of school choice. And even though I think their “tradition versus innovation” distinction doesn’t neatly align with the distinction between district schooling and school choice, it serves as a welcome reminder that choice advocates should also emphasize the ways in which choice can strengthen local communities, and how private and (perhaps especially) religious schools are already vital parts of the communal fabric.


Hitt, McShane and Wolf Meta-Analysis leads to a call for humility

March 19, 2018

(Guest Post by Matthew Ladner)

My favorite quote from Hitt, McShane and Wolf’s new study:

Even with these caveats in mind, the policy implications from this analysis are clear. The most obvious implication is that policymakers need to be much more humble in what they believe that test scores tell them about the performance of schools of choice. Test scores
are not giving us the whole picture. Insofar as test scores are used to make determinations in “portfolio” governance structures or are used to close (or expand) schools, policymakers might be making errors. This is not to say that test scores should be wholly discarded.
Rather, test scores should be put in context and should not automatically occupy a privileged place over parental demand and satisfaction as short-term measures of school choice success or failure.

P.S. Letting parents take the lead on which schools expand and/or close can work out fine on the types of tests schools have almost no ability/incentive to game:

The implications of this meta-analysis of the research literature could stretch far beyond the choice sector in time. If test scores continue to show a weak and inconsistent relationship with long-term outcomes, broad rethinking will be required. Let’s see what happens next.


Systematic Review of the Disconnect Between Test Scores and Later Life Outcomes

March 19, 2018

Today AEI released a systematic review by Collin Hitt, Mike McShane, and Pat Wolf on the relationship between changes in test scores and changes in later educational attainment in rigorous studies of school choice programs.  I’ve been writing and talking about this for some time now, inspired to a large degree by informal conversations with the authors of this new report.  Now they have made the point more systematically.

They examined every study of school choice programs with both test score and attainment effects, consisting of “39 unique impact estimates across studies of more than 20 programs.”  They examine whether the direction and significance of the estimated effects of those programs on test scores are consistent with the direction and significance on attainment.  They are not.

They find: “Across the studies we examine, there is no significant or meaningful association between school choice impacts on math scores and high school graduation or college attendance. Nor are ELA impacts meaningfully associated with high school graduation rates. Under some tests, the relationship between ELA impacts and college attendance are significant—but the relationship is weak in magnitude, and the sample of studies is far narrower for college attainment than for high school graduation.”

Keep in mind that the policy relevant question is not whether individual changes in test scores are correlated with individual changes in attainment.  There is some research that has found this relationship (see for example Chetty, et al), but a surprising number of studies find no or only a weak relationship between individual gains on these near-term and later-term measures of success.  But none of them directly address the policy relevant question of whether aggregate test score changes at the school or program level are predictive of aggregate changes in attainment.

If we are going to judge schools or programs as good or bad based on changes in test scores, then those aggregate measures (not individual results) should be predictive of later success.  The fact that they are not, at least when judging school choice programs and schools, suggests that there is something fundamentally wrong with how we have approached public regulation (wrongly called “accountability”) of those programs.  You can’t regulate the quality of schools and programs if you can’t predict their quality.


Arizona Teacher Pay Frustration is Genuine but Misdirected

March 15, 2018

(Guest Post by Matthew Ladner)

A 7-year veteran teacher teaching in Arizona’s Paradise Valley Unified School District has created a social media firestorm by posting her pay stub on social media- $35,621. Before writing anything else, I like anyone else want to pay dedicated teachers much better than this. Teacher compensation decisions however are made at the district/campus level, and an examination of PVUSD finances just makes things look worse. Much worse.

The Arizona Auditor General reports on district finances. Paradise Valley received total revenue of $10,143 per pupil in 2017. This figure is above the state-wide average.  A class of 30 students produces over $300,000 in revenue. Even with benefit costs included, teacher compensation will not even sniff 20% of the revenue generated by this class of 30. Where did the rest of the money go?

This chart from the Heritage Foundation tracks national data, and provides a big part of the answer- American schools have seen a vast increase in the hiring of non-teachers. This is not to say that any school can ever do without non-teachers, but at one point we had 2 teachers for every non-teacher in American schools. These days it looks more like 1 to 1. Despite a substantial increase in inflation adjusted spending per pupil since the 2-1 days, the large increase in non-teaching staff places a limit on teacher salaries.

Ms. Milich works for a district that receives over $10,000 per pupil in revenue. That district has both an elected school board and a chapter of the Arizona Education Association that is very active in the politics of the district. A teacher with seven years under her belt getting paid $35,000 does not suggest that either the district or the association has been placing a priority on teacher compensation.

Impossible? Just take another look at the chart. American schools have spent decades placing a priority on increasing school district employment, with a much stronger focus on non-teachers. What we refer to as “teacher unions” are actually “school district employee unions” and just as a quick mental exercise close your eyes and ask yourself: do you think the chart above would look that way if the NEA and AFT opposed these trends? What if they had been supporting them for decades?

Ok open your eyes now. Get it? Good.

This teacher has every right to feel frustrated. I hope the district decides to compensate her in a fashion commensurate with her contribution to her school. I strongly suspect that contribution is far greater than a low double digit percentage of the revenue her class generates.

Yes state spending and taxing decisions also play into this- but we should never forget that Arizona is not a wealthy state, has an unusually small working age population, and decides on school funding levels through direct and indirect democracy. In 2012 statewide voters declined to raise taxes for schools in Prop. 204 by a very wide margin. A few years ago voters (very narrowly) chose to increase school funding by increasing the payout rate from state land trust.

The lopsided loss in Prop. 204 and the narrow margin on the Prop. 123 vote both relate to a deep skepticism on the part of the public that increased funding will reach teachers like this one. This skeptical attitude is entirely justified. For instance, between fiscal year 2016 and 2017 per pupil revenue increased in PVUSD by $664 per pupil (from $9,497 to $10,143) and this teacher received a raise of $131.25 and this was after completing professional development.

Arizona voters decide school funding democratically, and they will have the opportunity to increase funding again in the future. Under the current district setup, the bucket looks to have multiple large leaks if the aim is to increase teacher compensation. Some of my tribe on the center right here in Arizona tends to think that these spontaneous teacher protest movements are secretly the work of the Arizona Education Association. I don’t believe this is the case. Although much of this frustration is misdirected at choice programs, things like this social media paystub are indicators of genuinely felt grievances.

It would be a huge mistake however to continue avoiding questions about district priorities.