
(Guest Post by Matthew Ladner)
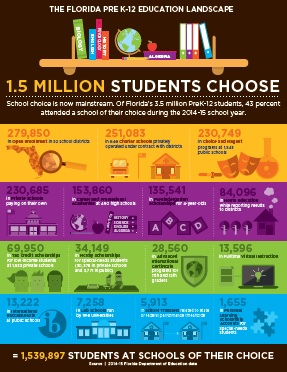
RedefinED has published their sixth look at the changing landscape of Florida education, reporting over 88,000 new choice students over the last two years.
(Guest Post by Matthew Ladner)
RedefinED has published their sixth look at the changing landscape of Florida education, reporting over 88,000 new choice students over the last two years.
 3 Comments |
  charter schools, tax-credit scholarships, vouchers | Tagged: Florida school choice, RedefinED |
  Permalink
 Posted by matthewladner

(Guest Post by Matthew Ladner)
Jason and John White have been having a public dispute over the interpretation of the NBER Louisiana study. I await Jason’s response, and given the importance of the subject I hope both sides of this debate will take pains to avoid vitriol as it unfolds. A reasoned examination of the evidence will best serve us, and everyone should acknowledge in advance that we bring a variety of assumptions to the table with us in this debate.
There is one point in John’s response that I would like to address presently. Early on the Superintendent says:
More important, however, is the larger implication I take from Mr. Bedrick’s thesis: that private school choice advocates in America, Mr. Bedrick among them, have failed to establish a coherent, prevailing belief system about the role of private schools in providing an education of measured quality, at scale, for the nation’s most disadvantaged youth.
Towards the end he says:
Absent better systemic answers than those offered by ideologues, publicly funded private school choice for all children will continue to be more of a factor in legislative debates and scholarly conferences than in the homes and neighborhoods of America’s youth.
The use of the word “measured” in the first statement brings up the observer effect from physics: the act of observing can in itself change what you attempt to measure. People can have honest disagreements over how much private school participation we are willing to sacrifice for what type of measurement, but let’s not start with the premise that the answer is “whatever it takes no matter what.” For almost going on two decades now for instance the McKay Scholarship program has reigned as the largest voucher program in the country. Would I prefer having an evaluation component of some sort? Yes-I’m pretty confident that we would learn valuable information. Would I be willing to do it if a large portion of participating schools were likely to pass on participating? No- I would be content to let parents work out testing on an individual basis with their schools.
In other words I want to prioritize the needs of parents over my needs as an advocate.
On the issue of scale and having a plan, I think we could have a long debate about this, but ultimately I don’t think it is necessary. I think that the sort of effort that Superintendent White is referencing may relate to the sort of private philanthropic efforts we see going on in the New Orleans charter school space. An unexplored possibility to consider by the way, is that the Herculean private human capital efforts we see going on in the charter space may have eclipsed the private school sector. How many rational actors would open a private as opposed to a charter school in New Orleans given the totality of policy and private philanthropic efforts? But I digress…
The reason I don’t think we need to spend too much time debating the sort of genuinely heroic efforts we see going on in the New Orleans charter space: I don’t think we can afford to scale them. You don’t see it discussed often, but ah, well, the cost per teacher placement from sources like Teach for America has not been going down. Quite the opposite from what I understand. Don’t get me wrong- I love TFA kids and I fully support the efforts of philanthropists in rebuilding the New Orleans education system. I simply have my doubts that our collective philanthropic efforts could have handled a district the size of Houston had Katrina veered that way, much less the rest of the country.
This raises the question- can we achieve “an education of measured quality, at scale, for the nation’s most disadvantaged youth” without these sort of efforts? If you care about the disadvantaged, the answer had better be “yes” because otherwise they will be remain holding the short end of the stick in life. To answer the question, I decided to examine the NAEP results and trends for low-income kids in the relatively regulated and highly philanthropic supported charter sector in Louisiana with similar kids in the Wild West and (relatively) lightly supported Arizona charter sector.
To get as close to apples to apples as possible, I compared the results for Free and Reduced lunch eligible students in general education programs attending charter schools in both states. The general education focus is due to possible differences in participation among ELL and SPED students in the two states. Louisiana has a comprehensive effort to support charters and to shut them down when they under-perform. If you see race as a proxy for other unmeasured factors etc. the average low-income charter child in Arizona is likely to be Hispanic, whereas I’m guessing in Louisiana they are more likely to be Black. Every state has their story about how their poor kids are the toughest to educate in the world (here is AZ it is “they come up North and they don’t even read Spanish!”) but I view all such claims as suspect-poor kids are tough to educate everywhere.
In terms of charter sectors, Arizona has an almost entirely decentralized process of school creation, and the only people making plans are those opening schools and parents seeking places for their child- no common app, the state rarely shuts a school down. etc. We have some TFA kids but I met more of them in a visit to the French Quarter than in 13 years of living here in AZ. The West in short doesn’t get any wilder.
The NAEP will only provide data for this comparison between 2013 and 2015, and I make no claims regarding this being a definitive comparison, merely suggestive. So with those caveats: here is what the gains look like across all four NAEP exams for FRL general ed charter students:

So both sectors did well in generating gains overall for low-income kids- so bully for them. Louisiana charters enjoyed larger gains in 4th grade gains, but Arizona charters enjoyed a still larger advantage at the 8th grade level. If we look at the overall scores for these students rather than the gains, we see no decisive advantage for either state.

Those who care about the interests of poor children should celebrate the ability of Arizona charter schools to deliver big gains for low-income kids. They did it without direction from the state and without massive support from philanthropists. This is to be celebrated in large part because we don’t have enough philanthropy to do New Orleans everywhere even if we wanted to.
So- as one of the school choice Jeffersonian types, I’ll address Superintendent White’s point about a plan squarely. What is my plan? On charter schools, my plan is to let ‘er rip. It’s working out a splendid fashion and I love it when a plan comes together…

On private choice, I’d like to see a system that gives a meaningfully higher level of public subsidy to disadvantaged children (low-income, ELL, SPED) with some light touch academic transparency measures (NNR testing required by students rather than schools, academic studies, parent surveys) and then let that rip too. The great virtue of this plan in my view is that it doesn’t require me or anyone else to manage or direct it.
In other words, I think school choice technocrats should aspire to be in control of as little as possible. The NBER study reinforces my view of its desirability.
UPDATE: Jason’s response to Superintendent White is up at Ed Next
1 Comment | charter schools, Education Savings Accounts, vouchers | Tagged: Jason Bedrick, John White | Permalink
Posted by matthewladner

(Guest Post by Matthew Ladner)
My friends at the Arizona Charter School Association put together this rocking graphic on Cactus Patch charter students RAWKING the 2015 NAEP. Make sure to check out the two mini-graphs at the bottom showing just how much more diverse AZ charters are than the states in their neighborhood of scores and how how the per pupil funding stacks up. Stare at them long and hard, and think about the times you’ve heard people say things like the following. Maybe you said them yourself:
Oh but it’s the Wild West out here. Oh they really should not have let so many charter schools open, they should be more cautious about authorizing like right thinking people back East. Tut-tut, KIPP won’t open a school there at that funding level.
Line forms to the left to either update your flawed thinking and/or offer your heartfelt apology. There’s still room on the bandwagon for those who follow the evidence where it leads.
1 Comment | charter schools | Tagged: Arizona Charter School Association, Arizona charter school NAEP scores | Permalink
Posted by matthewladner

(Guest Post by Matthew Ladner)
I’ve been taking a close look at DC education, and I must say I’ve learned a lot- both good and bad. One of the bad things would be these charts from the Urban Institute showing that private schools are going the way of the Dodo in the District of Columbia. K-5 is above and grades 6-8 below:

A couple of notes: we’ve known for some time that charter schools hit private schools harder than districts- and well here you have it again. Also note that the collapse comes in spite of the DC Opportunity Scholarship Program starting in 2004. DC’s charter school law effectively operates as a universal school choice program that reliably delivers more than $14k in funding to all comers, but limits the universe of schools to young and/or startup schools.
Now mind you, this is less than half the revenue per pupil in the District of Columbia Public Schools (traditional district-see Census Bureau second bullet Tab 11) and they get better academic results than the district at this lower cost. Bully for them. The law of unintended consequences however is a cruel mistress and she has been whipping DC private schools with a bloody cat o’nine tails.

No but you can have this…
The DC Opportunity Scholarship program meanwhile only offers a maximum of $8,381 per child for students in K-8, and unless it is both reauthorized and redesigned one cannot help but wonder if there will be many private schools for these students to attend in the years ahead. Please someone explain to me how it makes sense for a charter school law to operate as a defacto universal choice program at $14k per child, while the private choice program offers substantially less per child and only to poor children. The Urban Institute data clearly indicates that this is a recipe for extinction of the private school sector outside of elite institutions. To put matters bluntly- who in their right mind would seek to open a private school in preference to a charter school in DC under this system of finance? Did you miss the part where private schools have been dropping like flies while charter schools proliferate? The funding for charters is large, universally available and reliable. The funding for DC Opportunity Scholarships is small, restricted and uncertain.
It’s little wonder why a number of D.C. Catholic schools gave up the ghost a few years ago and converted into charter schools. The school financing system practically clubbed them over the head. I’d like to invite my friends from the pro-means testing wing of the private choice movement to reflect upon the viability of supporting DC style scholarship programs when those programs must compete with defacto universal choice programs with far greater funding. Who wins that battle? Sadly the universal program restricts eligibility to young/startup schools with limited curricular diversity- how does this make sense? If parents decide to extinguish private schools as a result of a remotely equitable competition, you won’t see me shedding any tears. Our currently policies however make it look like we are out to quash private schools kind of like, well, this:
Leave a Comment » | charter schools, school funding, vouchers | Tagged: DC Charter Schools, DC Opportunity Scholarship Program, private school closures DC, Urban Institute | Permalink
Posted by matthewladner

[Guest Post by Jason Bedrick]
As more North Carolina families are using school vouchers, enrolling their children in charter schools, or homeschooling, some traditional district schools are experiencing slower growth in enrollment than anticipated. The News & Observer reports:
Preliminary numbers for this school year show that charter, private and home schools added more students over the past two years than the Wake school system did. Though the school system has added 3,880 students over the past two years, the growth has been 1,000 students fewer than projected for each of those years.
This growth at alternatives to traditional public schools has accelerated in the past few years since the General Assembly lifted a cap on the number of charter schools and provided vouchers under the Opportunity Scholarship program for families to attend private schools.
Opponents of school choice policies often claim that they harm traditional district schools. Earlier this year, the News & Observer ran an op-ed comparing choice policies to a “Trojan horse” and quoting a union official claiming that “public schools will be less able to provide a quality education than they have in the past” because they’re “going to be losing funds” and “going to be losing a great many of the students who are upper middle-class… [who] receive the most home support.”
Setting aside the benefits to the students who receive vouchers or scholarships (and the fact that North Carolina’s vouchers are limited to low-income students and students with special needs), proponents of school choice argue that the students who remain in their assigned district schools benefit from the increased competition. Monopolies don’t have to be responsive to a captive audience, but when parents have other alternatives, district schools must improve if they want to retain their students. But don’t take their word for it. Here’s what a North Carolina public school administrator had to say about the impact of increased competition:
New Wake County school board Chairman Tom Benton said the district needs to be innovative to remain competitive in recruiting and keeping families in North Carolina’s largest school system. At a time when people like choice, he said Wake must provide options to families.
“In the past, public schools could assign students to wherever they wanted to because parents couldn’t make a choice to leave the public schools,” Benton said. “Now we’re trying to make every school a choice of high quality so that parents don’t want to leave
Wake County is not unique in this regard. As readers of this blog surely know (and as I’ve written elsewhere), there have been 23 empirical studies investigating the impact of school choice laws on the students at district schools. As shown in the chart below, 22 of those studies found that the performance of students at district schools improved after a school choice law was enacted. One study found no statistically significant difference and none found any harm.

Beating district schools over the head with more and more top-down regulations has done little to improve quality. A better approach is bottom-up: empower parents with alternatives and give district schools the freedom to figure out how to provide a quality education that will persuade parents to choose them.
[A version of this post was originally published at Cato-at-Liberty. Hat tip to Dr. Terry Stoops of the John Locke Foundation for the story from New Wake County. Thanks to Bob Bowdon of Choice Media for the image.]
Leave a Comment » | charter schools, competitive effects, tax-credit scholarships, Uncategorized, vouchers | Permalink
Posted by Jason Bedrick
(Guest Post by Matthew Ladner)

Let’s the speculation shift from “are those AZ charter NAEP scores real?” to “did the NAEP underestimate the scores?” As the lovely Teri Hatcher once said:

Leave a Comment » | charter schools | Tagged: Arizona charter school scores, Arizona NAEP scores, AZ Merit | Permalink
Posted by matthewladner
(Guest Post by Matthew Ladner)
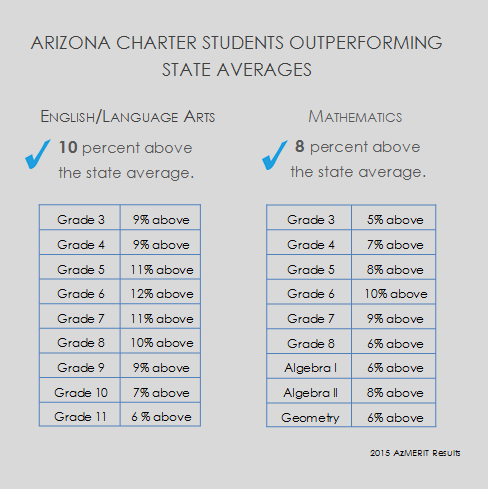
Laissez le bon temps rouler! The AZ Department of Education released results of the new AZ Merit test, and the Arizona Charter School Association released a breakdown of the scores showing that AZ charter school students scored 5%-12% higher scores depending upon the grade level/subject (see below).
Sadly the AZ Merit data comes in the form of an excel spreadsheet rather than a NAEP-like data slicer, so a control for differences in student demographics, program status, etc. cannot be readily performed. Some of the differences in scores between AZ charters and districts are likely to be explained by student differences. When you examine the NAEP, it is also the case that some of the differences between New England states and a state like Arizona will also be explained by student differences. No one I know however doubts that the average public school in MA outscores the average public school in AZ.
AZ Merit aligns much more closely to NAEP in terms of student results than the jumped the shark over a decade ago AIMS test. The differences observed in raw scores are generally larger than those existing between the top NAEP state (MA) and Arizona. The AZ Merit scores therefore reinforce the NAEP data’s finding that Arizona charter schools have something special cooking out in the cactus patch.

Korea- your scores are next!
2 Comments | charter schools, NAEP | Tagged: Arizona NAEP scores, AZ Charter school test scores, AZ Charter schools AZ Merit | Permalink
Posted by matthewladner

(Guest Post by Matthew Ladner)
Hispanic students attending charter schools in Florida and Arizona both scored about a grade level ahead of Hispanic students attending district schools. Figure 1 shows where this lands them in terms of statewide averages for all students. Notice that Hispanic students attending charter schools in Florida are almost a grade level ahead of the statewide average for all students in Florida.
Nationwide all students in public schools scored 281 on 8th grade math in 2015. This means that AZ and FL Hispanic students ended in a statistical dead head with the average. Hispanic students in charter schools have gained 20 points in Arizona and 19 points in Florida over the 2005 averages. This reflects several things- including a lot of hard work by the students and teachers- but also perhaps maturing charter sectors with startups full of kids just transferring into the startup school impacting scores less than in the past.
4 Comments | charter schools | Tagged: Arizona charter school NAEP scores, Florida charter school NAEP scores | Permalink
Posted by matthewladner
(Guest Post by Matthew Ladner)
So I’ve still been digging into the AZ NAEP data. When something seems too good to be true, it is best to assume it isn’t true. I decided to investigate the possibility that something goofy was going on with the free and reduced lunch variable. Not all Arizona charters choose not to participate in the program, and the eligibility criteria for the program has changed over time.
Parental education may be a good stand-in for what may be a suspect income variable. At the 8th grade level, the NAEP data slicer has an a variable for parental education. The below figure presents the 8th grade math scores for students with college graduate parents. In order to account for possible differences in special program participation, the figure is only for general education students with college graduate parents (the ranking results don’t change much if you look at all students). I will again stress that these comparisons do not substitute for a proper random assignment study-only that they tell us more than an examination of aggregate scores for all students.

Watch out New England…Arizona charter schools are coming to get you!
![]()
For you incurable skeptics, the below figure presents the same comparison using 8th grade reading, and bear in mind that each NAEP test involves a different sample of students.

We can also look at these numbers by race/ethnicity. NAEP provides subset numbers for Anglos and Hispanics attending charter schools in Arizona. Here is the NAEP 8th grade reading test for Hispanic students:

And here it is for Anglo students:

Okay but what if those Arizona charter schools are chock full of Anglo kids whose parents graduated college? Now the National Alliance of Public Charter Schools reports that Arizona charter schools have a majority-minority student body, so this is not the case- but what if a large portion of the Anglo kids attending charter schools have parents with college degrees? Ok, well, let’s compare Anglo kids whose parents graduated from college:

Did I mention the part where Arizona charter schools did this with $8,041 per kid in public funding? Better results at a lower cost is what America is going to need very soon- and well here it is. Massachusetts NAEP scores taste like chicken btw, only gamier, could use a little salt.

3 Comments | charter schools, NAEP | Tagged: Arizona 2015 NAEP scores, Arizona charter school NAEP scores, NAEP 2015 | Permalink
Posted by matthewladner

(Guest Post by Matthew Ladner)
I’m going to use my Professor X powers to read your mind…you are thinking “Alright Ladner enough with the Arizona NAEP scores- won’t you give it a rest?”
No I will not. There’s a party going on right here-it’s a celeNAEPtion and it lasts throughout the year.
I’ve anticipated some of the possible objections to celebrating Arizona NAEP scores. Maybe those dastardly charter schools may have been circumventing their random assignment admission lottery legal requirements to load up on rich white kids! Maybe they don’t have many English Language Learners, special education students, Hispanic students, etc. District schools have to take everyone who can afford to buy a home in their attendance zone so comparisons aren’t fair…

Well some find this a very useful story, but we can actually examine it in the data. Let me note from the outset that variations in student demographics and special program status do exist between schools and school systems, achievement gaps between such student groups are a well-established phenomenon and that some accounting for such differences should be (carefully) made if our goal is to judge the effectiveness of a system. The best way to test this sort of thing is with a well done random-assignment study, but sadly we don’t have one.
I reported earlier that Arizona charter schools essentially tied Massachusetts (the highest scoring state) and the private school national average scores on the NAEP 8th grade reading test in 2015. What happens if we only look at the scores of general education students whose family income make them eligible for a free or reduced lunch? If those dastardly charter schools have been carefully avoiding special needs and ELL students it isn’t going to help them with this comparison.
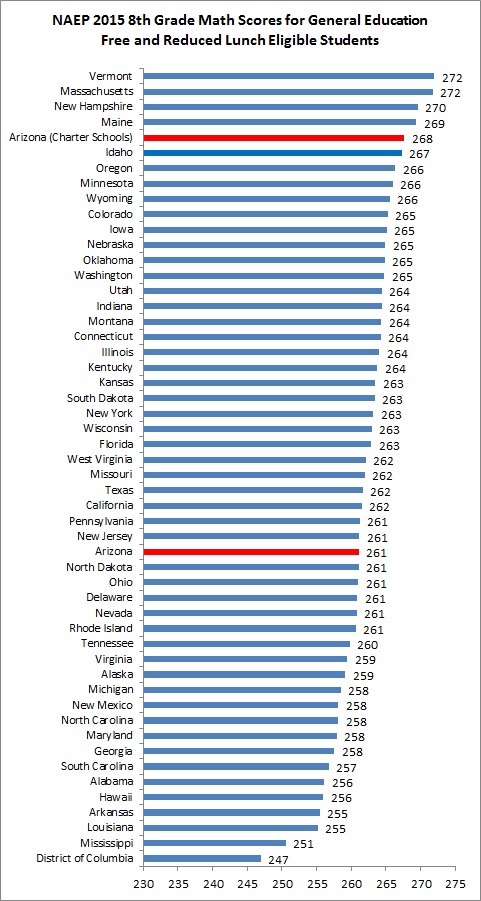
Let’s just put it on the table that free and reduced lunch eligible is going to translate to a higher proportion of Hispanic students in Arizona charter schools, but that was not a problem hombre. Do you notice anything similar about all those states (slightly) ahead of Arizona charter schools? Let me give you a hint…

Oh and…

2 Comments | charter schools | Tagged: Arizona charter school NAEP scores | Permalink
Posted by matthewladner
You are currently browsing the archives for the charter schools category.

