
(Guest Post by Matthew Ladner)

“The Force is with you young Charter Tejanos but you are not a mathematics Jedi yet. We would be honored if you would join us in CeleNAEPing good times!”
-Darth Cactus
(Guest Post by Matthew Ladner)
“The Force is with you young Charter Tejanos but you are not a mathematics Jedi yet. We would be honored if you would join us in CeleNAEPing good times!”
-Darth Cactus
 3 Comments |
  charter schools, NAEP | Tagged: Hispanic NAEP scores by state |
  Permalink
 Posted by matthewladner
(Guest Post by Matthew Ladner)
Oceania of Orwell’s 1984 made use of a daily “two-minute hate” to whip people into a frenzy against enemies of the state. As wikipedia explains:
Within the book, the purpose of the Two Minutes Hate is said to satisfy the citizens’ subdued feelings of angst and hatred from leading such a wretched, controlled existence. By re-directing these subconscious feelings away from the Oceanian government and toward external enemies (which may not even exist), the Party minimizes subversive thought and behaviour.
So about now you are wondering to yourself “why are you flashing me back to junior year English class?” Good question- I guess it came to mind because of things like this and this.

Jonathan Haidt describes the mind as an elephant (instinct) and a rider that serves the elephant (reason). The rider serves the elephant by seeking out information that confirms pre-existing beliefs, and avoids contradictory information. Individuals are thus not trustworthy in reasoning in support of their beliefs, but are pretty good at knocking down the theories of others. If however you find yourself isolated in an ideologically homogeneous tribe no one is likely to point out glaring flaws in your thinking as they either cannot or don’t want to see them any more than you do.
The problems with the above pieces seem entirely obvious to me, but apparently were invisible to the Republic. I knew this article was heading in a bad direction when I saw a former campaign manager for David Garcia described as “former BASIS parent.” Both of these descriptions are true…but one is incomplete without the other. The reporter’s effort in establishing whether the CMO management fee was reasonable given the services provided more or less ended with an assurance from a professional charter skeptic that it wasn’t. Well, can’t much argue with that…

Now for the record I don’t know the percentage of K-12 funds typically spent on the services provided by the BASIS CMO either. Given the outputs BASIS produces, I’ll confess to being broadly indifferent as to whether districts spend more or less. The Reporter’s elephant wanted to believe it was high, and sure enough he found someone to make this claim. Neither of them produced any evidence, or a rationale as to why we should care.
The two-minute hate moves into throw your shoe territory when our intrepid reporter reveals that the founders of the CMO put down a down payment on a condo in New York City…which is near private schools they operate…which charge approximately four times the amount provided by Arizona taxpayers to provide the same education that Arizona children receive free of charge. In an organization including charter schools in Arizona, Texas and D.C. and private schools in China, Silicon Valley and NYC that the highest ROI part of the operation would be in the modestly funded but very high performing AZ charter schools. The Republic reporter’s elephant lumbered off in the opposite direction however, with his rider helping to raise a vague concern that somehow Arizona taxpayers were being short-changed er somehow. In other pieces we see assertions that BASIS gets more funding per pupil than district schools in Arizona. A quick trip to the JLBC however reveals this to be false- charter schools get less total public funding per pupil than district schools in Arizona.
It is also common to see an organization critical of charter schools, the Grand Canyon Institute, described as “non-partisan” in the pages of the Republic. Having spent a few minutes on their website, I could detect no overt attachment to any political party, but the philosophical leanings of the group are entirely obvious (left of center).
I spent a number of years at the Goldwater Institute, and we spent years in public disputes and filed lawsuits challenging both Republicans and Democrats. Perhaps the memory fades, but I don’t recall the Republic referring to GI as “non-partisan.” When the GCI put out a report critical of charters, one of the paper’s columnists wrote that GCI “supports charter schools.” Things had just become soooo bad that they had no choice but to offer sharp but constructive criticism you see. GCI is run by a former official of the Janet Napolitano administration, and when I asked one of his former Napolitano colleagues about this assertion the reaction I received was “That’s absurd. George has always hated charter schools.” Again I assume that someone from GCI claimed to support charter schools, and it fit into what the columnist wanted to believe, but it isn’t terrible hard to check up on such things.
Now to be fair, the Republic does have some ideological diversity on the opinion page, which is approximately evenly split between a hard-left wing and an assortment of writers varying degrees to the right of Bernie Sanders. Center-right columnist Bob Robb has supported increased K-12 funding for years, but is an equal opportunity offender taking everyone from RedforEd to Governor Ducey to task. Centrist Joanna Allhands very helpfully noted for instance that er, guys, all schools raise money from parents, not just BASIS.
It’s not like the non-Bernie columnists challenge everything questionable put out by Team Bernie. If they did, they wouldn’t have much time to do anything else. The worst of it is that the news page seems be serving the elephant of the Bernie wing of the opinion pages: investigative pieces translate effortlessly into two-minute hate type opinion pieces.
For instance, when the Republic published a giant nothing-burger of a front page above the Sunday fold story about FOIAed emails between the Goldwater Institute and the Arizona Department of Education concerning the administration of the ESA program. Now if any of these emails were any more exciting than Jonathan Butcher writing to the Department to say “Guys there are ESA parents out here who haven’t had their accounts funded on time and they are getting very upset about it” I assume the Republic would have shared them with us. Gleefully. Instead, the Reporter’s elephant went in search of someone who would confirm that there was something very naughty going on:
“This is almost an iron grip-level of influence from the beginning of the process on,” said Thomas Holyoke, an associate professor of political science at California State University-Fresno, who studies interest groups and lobbying.
“This sounds like a full-service operation; it wasn’t just writing the legislation,” he added. “You have elected officials, who are supposed to be repositories of the public’s trust, who are pushing legislation and probably building careers off of big, high-profile bills that have some potentially extremely far-reaching effects.”
I won’t rehash the glaring flaws in this story here, but will ask a very basic question: if the Goldwater Institute had an “iron grip” on the administration of the program, isn’t it reasonable to think that accounts would be funded on time, proper records kept, etc?
Team Bernie on the opinion pages lapped it up. Worse still, when the Goldwater Institute asked to publish a response, the Republic chose not to publish it. This sort of thing has led to a large number of right of center Arizonans to angrily mutter about how they cancelled their subscriptions years ago, that the Republic is hopelessly biased, they only hung on for as long as they did to read Robb, etc.
I wouldn’t be writing this post if I were willing to join this line of thinking. I believe that keeping some common institutions to be of unspeakable importance. Checking out to entomb oneself in a comfortable echo chamber is a path to hopeless polarization. A few years ago the Arizona Chamber of Commerce began a “Race to the Tap” event with the hope of getting people from different K-12 silos at least occasionally talking to each other.

I’m pretty sure that Geoff Esposito pictured here with yours-truly makes Laurie Roberts look like a second coming of Barry Goldwater. I’m fairly confident that Geoff helped to draft the catastrophic mistake of a soak the rich tax initiative the Invest in Ed ballot initiative that would raise Arizona incomes taxes to New Jersey levels. Geoff and I don’t agree on much related to K-12, but we do listen to each other, which is an art that Americans are losing much to our detriment. Arizona could use a good deal more tap and less two-minute hates.
4 Comments | charter schools, Education Savings Accounts | Tagged: Arizona Chamber of Commerce and Industry, Arizona Republic, Bob Robb, Craig Harris, Geoff Esposito, Laurie Roberts, Yvonne Wingett Sanchez | Permalink
Posted by matthewladner
(Guest Post by Matthew Ladner)
Neerav Kingsland has written a response to posts by Jay and yours truly on Louisiana charters generally and the Recovery School District specifically. I will begin by confessing a sin- Neerav is correct that I go a bit over the top at times. The “Prime Directive” of JPGB has always been first and foremost for the authors to entertain ourselves. We do occasionally take ideas seriously, but we try to keep things light around here, which often involves reasoning by pop-culture analogy. Maybe some gratuitous use of an animated gif here or there, or an occasional musical interlude. All in moderation of course…
Like Leo Moracchioli we try not to take ourselves too seriously, but one idea that I do take very seriously is the one quoted in the original post from Jonathan Haidt, which merits repetition:
In the same way, each individual reasoner is really good at one thing: finding evidence to support the position that he or she already holds, usually for intuitive reasons. We should not expect individuals to produce good, open-minded, truth-seeking reasoning, particularly when self-interest or reputational concerns are in play.
But if you put individuals together in the right way, such that some individuals can use their reasoning powers to disconfirm the claims of others, and all individuals feel some common bond or shared fate that allows them to interact civilly, you can create a group that ends up producing good reasoning as an emergent property of the social system. This is why it is so important to have intellectual and ideological diversity within any group or institution whose goal is to find truth (such as an intelligence agency or community of scientists) or to produce good public policy (such as a legislature or an advisory board).
I do not wish to allow even the JPGB Prime Directive to interfere in this. I appreciate that David Osborne offered some comments, and that Neerav also took the time to respond in a civil fashion. I offer an apology if my bombast lacked civility as it must not interfere in the free exchange of evidence and ideas.
On the substance, I’ll offer the following comments in the spirit of the Haidt quote:
My preexisting bias before the release of the 2017 NAEP was that the Louisiana RSD was a clever policy innovation given the circumstances of post-Katrina New Orleans, but that the concept employed enormous amounts of financial and human capital. Perhaps too much of both to be of general interest.
David Osborne noted in a comment that only 43% of Louisiana charters are New Orleans RSD charters, which is a fair point to make. This however is about 43% more than the typical state, and a portion of the rest Louisiana’s charters are RSD charters operating outside New Orleans. Osborne noted in a comment that those charters aren’t going so well. In my preexisting frame, I interpret this as RSD not being able to make the trip down the Atchafalaya Bridge from New Orleans to Baton Rouge, much less to other states. This seems like confirmatory evidence to me, but maybe not. If not, why not?

NAEP data is still indeed inexact on this point, but state testing data for New Orleans specifically has also been in decline. NAEP shows large statewide declines in charter scores since 2013, and the state’s own testing data pointing in the same direction specifically for New Orleans.
What sort of evidence would lead a reasonable person to conclude that the RSD model is very difficult to replicate and to sustain? We all have theories of change, but is this one falsifiable? I believe that the combination of statewide NAEP scores and the decline of state test scores in New Orleans is an issue. I’m in favor of RSD continuing in New Orleans, but nothing about the evidence produced last few years is giving me the itch to replicate it in my home town.

Speaking of Phoenix, Neerav (correctly) noted a Credo multivariate study showing meh charter results in Arizona. Harvard’s Marty West found similar results, but both Credo and West used data that ended in 2012. I won’t go into the details here but I believe Credo, West, recent NAEP and recent AZMerit can all be correct. The 2012 Philadelphia Eagles went 4-12 but they won the Superbowl last season. Between lots of openings, closings, and schools maturing past their training wheels stage, AZ charters turned over their roster like a pro-sports team.
RSD advocates have a theory of change largely based upon increased state test scores in New Orleans. The more recent state data and NAEP however both seem to be signalling a warning sign. If this is just my preconceived notions getting the better of me, please help me out. Nevermind Arizona, based on anything and everything we can gather from Credo, NAEP, recent state scores and even random assignment studies, why should Louisiana charter policies be touted in preference to Michigan’s based upon the available results?
2 Comments | charter schools | Tagged: Arizona charter school NAEP scores, Leo Moracchioli, Michigan charter school NAEP scores, Neerav Kingland, Recovery School District, Toto | Permalink
Posted by matthewladner

(Guest Post by Matthew Ladner)
When I was a kid in the 1970s someone wrote a book about UFOs having visited earth in the past called Chariots of the Gods. The only thing I remember about this book was a photo of an ancient stone staircase and a caption that read “Staircase going down-to a spaceport?” Someone else wrote a book called “Crash Go the Chariots.” I never examined this book, but I imagine that it was a bit like shooting fish in a barrel.
I am in the midst of reading Jonathan Haidt’s The Righteous Mind: Why Good People are Divided by Politics and Religion and found the following passage quite striking. The book summarizes a great deal of psychological research to reach this point which I cannot do justice to, but roll with this in any case:
In the same way, each individual reasoner is really good at one thing: finding evidence to support the position that he or she already holds, usually for intuitive reasons. We should not expect individuals to produce good, open-minded, truth-seeking reasoning, particularly when self-interest or reputational concerns are in play.
Sounds dismal so far, but fortunately he goes on…
But if you put individuals together in the right way, such that some individuals can use their reasoning powers to disconfirm the claims of others, and all individuals feel some common bond or shared fate that allows them to interact civilly, you can create a group that ends up producing good reasoning as an emergent property of the social system. This is why it is so important to have intellectual and ideological diversity within any group or institution whose goal is to find truth (such as an intelligence agency or community of scientists) or to produce good public policy (such as a legislature or an advisory board).
Again, I can’t summarize the research that lead to this conclusion (read the book and see what you think) but basically Haidt lays out a case that says if you believe that you are some sort of scientist guided solely by sweet reason and evidence, you are the victim of self-delusion. Good reasoning happens through a social challenge process over time.
In that spirit of civil challenge, I’ll offer the following two charts. The first a scatterplot of the 8th grade reading 2017 scores by gains (2017 minus 2009 scores) for all 50 states and all 16 state charter sectors with scores in both 2017 and 2009.
There is a huge amount of success to celebrate in this chart for multiple state charter sectors, most of which have either unusually large gains, or unusually high scores, or else unusually high scores and gains.
Do however take note of Louisiana’s charter sector position in the above chart. Now let’s look at the same chart for mathematics:

Again, there is a great deal to like here- multiple charter sectors with large gains (MI, WI, GA, MD, TX) or high scores (CO, ID) or both high scores and gains. Arizona, this one is for you:
Again however take a look at Louisiana’s charter sector-again low scores and low gains. A quick trip to the NAEP data explorer will demonstrate that this same trend is evident in 4th grade NAEP scores, and state scores have been trending in a negative fashion in recent years as well.
In recent years a school of thought arose in our space that a centralized authority or “harbor-master” could produce better outcomes by carefully controlling both the entrance and the exit of schools from charter sectors, primarily on the basis of standardized test scores. In the case of the Recovery School District in Louisiana, there was a period of strong gains in state test scores to buttress this belief. State test scores however have repeatedly shown themselves vulnerable to gaming and manipulation, especially when large consequences ride on them. Soviet steel makers reported non-stop prodigious growth in steel production for decades when facing such incentives as well. How much steel was actually made-who knows? Educators however have neither the incentive or ability to “teach to” or otherwise game the NAEP exams, which is why they have long stood as an external audit on state testing.
In this case, NAEP and state tests are both pointing in the same direction.
My preexisting belief, laid out previously on this blog, is that RSD was a very clever policy innovation for a district that at one point had little more than empty buildings to leverage. I’ve also however long suspected that the notion was over-hyped and ignored some very basic political realities. When for instance Denver announced that yeah, well, about that whole making facilities available thing, we’ve kind of discovered that we are a school district and that our dominant special interests don’t really like this idea after all. The reaction in my tribe was something along the lines of “duh- what did you think was going to happen?”
I’ll go further and say that RSD has a false allure for many of our technocratic friends: things can get better, but only if someone is in charge. Someone like me. True relinquishment means letting go: let operators develop new models, let parents respond to them, let the primordial soup bubble and bake. Don’t assume that you know what constitutes a “high quality education,” don’t aim a narrow vision of quality at a single type of community, allow the interplay of different choice programs to flourish.
Now, having fully confessed my preexisting beliefs, I have offered evidence that I believe confirms them. If someone has countervailing evidence to present, the comment section awaits your thoughtful challenge. If you buy into the harbor-master system, come and defend it.
7 Comments | charter schools | Tagged: Chariots of the Gods, Crash Go the Chariots, Jonathan Haidt, Portfolio Districts, The Righteous Mind | Permalink
Posted by matthewladner

(Guest Post by Matthew Ladner)
So Arizona charter schools rocked the 2017 NAEP again. In 8th grade math, Arizona charter students narrowly scored below the top scoring state (Massachusetts) in 2015 and above them in 2017. Arizona charter schools educate a majority minority student body, both overall and specifically in 2017’s 8th grade class. It’s really quite extraordinary to see them in the same academic neighborhood as MA, given their majority-Anglo, high income, spend twice as much per pupil combo status. If MA is a good sport, they would fight left handed- what chance does a majority-minority school system with half the spending per pupil have against the highest performing state education system in the nation many years running?

I decided to dig into the details.
The Free and Reduced Price lunch definition has become fairly sketchy, so in the below comparisons I will make use of parental education as a proxy for socio-economic status. Another source for variation between states and sectors involves special program students, so the below comparisons will focus on general education students (neither ELL nor SPED). The first set of scores are for students whose parents did not finish college and are in the general education program:

Massachusetts is still winning the duel, but not comfortably-switch to the right hand? Note for the record that 10 out of 10 of the top performing states have a majority Anglo student population. In fact you don’t spot a majority minority student population state until Texas pulls in at #19. Did I mention before that Arizona charter schools are majority minority? Oh, yes, well good that again then.
Now let’s run the same numbers for general education students with college graduate parents. This should be the MA right handed fighting btw- far more fancy degrees in Massachusetts than Arizona after all, more graduate degrees as well. Well, Arizona charter kids are not left-handed either:


14 Comments | charter schools, NAEP | Tagged: Arizona Charter Schools NAEP 2017 | Permalink
Posted by matthewladner
(Guest Post by Matthew Ladner)
Yesterday we went over how states have done very little to improve in 8th grade math since 2009, but how many state charter sectors rocked it. Let’s see about reading, starting with the states:

There are more declines in scores than statistically significant gains in that first chart-some states more lost than others, but a lost decade nationally. Next let’s look at statewide charter sectors-these are the states with charter sectors large enough to make the sample in both 2009 and 2017 in 8th grade reading:

Once again, just as with math, Excel had to move the growth axis scale for several state charter sectors. You will appreciate this better when the following chart combines statewide averages and state charter sector averages:
So in this chart ideally you would like to see high scores and high gains, but there is no shame in just very high scores.
Can you dig it?
Leave a Comment » | charter schools, NAEP | Tagged: 2017 NAEP, Charter NAEP Scores | Permalink
Posted by matthewladner

(Guest Post by Matthew Ladner)
The news overall is grim. You want to be in the top right quadrant of this chart. Some states thankfully did land there-including the state with the largest student population- but many only barely due to small reading gains. If you need the dot size to push you in, it doesn’t count-better luck next NAEP.
You don’t want to land in the top left or in the bottom right, and you most of all don’t want to see your state in the bottom left quadrant (declines in both subjects). Mike Petrilli used the phrase “lost decade” to describe the results. Some states seem far more lost than others, but it is hard to find fault with that assessment overall.
The two main reform strategies employed since the 1990s have involved test-based accountability and increased parental choice. During the era covered by the top chart, the test-based folks swung for the fences by creating a federal incentive for states to adopt a preferred set of academic standards and to pass statewide teacher evaluation systems based upon the scores on those tests. Gigantic investments of political and financial capital supported these policy changes, but it is hard to characterize the results as much more than disappointing.
Now some of you will be thinking around about now “oh yeah but we’ve expanded choice during this period as well!” That is true, and while we have numerous studies establishing positive competitive effects on district schools from choice programs, few states have choice programs going at a scale to place a large amount of pressure on district enrolments. NAEP does however allow us to track state charter sector gains over time. Sixteen state charter sectors had scores for 8th grade math and reading in both 2009 and 2017, allowing the following calculation:

Excel had to change the scale of the axis for the above chart. You may not have noticed. Putting state averages and state charter sector averages into the same chart will help:

Suddenly those statewide gains in Arizona, California and Mississippi (i.e. the good ones) from the first chart don’t seem so impressive eh? I’m thinking out loud here and inviting you along for the ride. Gains aren’t everything, so the next iteration will include achievement and gains by subject area, but for the huge gainer sectors (spoiler alert) they didn’t get that way with low 2017 scores. I could go on about standard errors being bigger for charter sectors and whatnot, but who are you going to believe a boring statistics lecture or your own lying eyes? If someone can explain why random error would systematically dramatically favor charter sectors, I’m all ears and the comment section eagerly awaits your thoughtful challenge.
In fact there is a white lie in the above chart-some of the sectors and states that look meh in this chart immediately above had very high scores in both 2009 and 2017, and while not ideal there is no crime in holding your mud with high scores. Last year my friend Robert Pondiscio convinced me that combining achievement and gains to provide a clearer picture, so here goes for 8th grade math:
In this chart you either want to have large gains, or high scores, or preferably both of these things. I’m for instance not inclined to criticize Idaho charter schools for modest gains given that they outscore Massachusetts and all despite spending about half the amount per pupil.
Well…yup it is officially time:
5 Comments | charter schools, NAEP | Tagged: 2017 NAEP, NAEP score trends | Permalink
Posted by matthewladner
(Guest Post by Matthew Ladner)
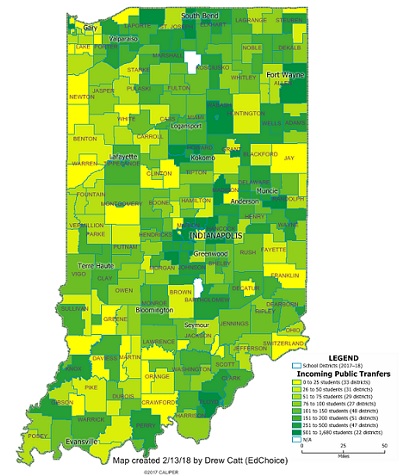
Ed Choice’s Drew Catt created this open enrollment map of Indiana. For those squinting at their iPhones, bright yellow signifies a district taking in 0-25 open enrollment students, while dark green denotes a district bringing in 501 to 1,680 open enrollment students.
So let’s contrast this with the Fordham Ohio open enrollment map:

The Fordham map denotes participation/non-participation by districts in open enrollment. Suburban non-participation jumps off the page of the Fordham map, so let’s contrast Indianapolis with Columbus. The Indiana map has a lot of green around Indianapolis, signifying open-enrollment participation by the suburbs.
Now let’s compare Indiana to the open enrollment data available from Arizona.

Much larger numbers in these Arizona districts, but also a broader definition of open-enrollment being utilized for the Arizona data that includes students transferring within district boundaries. Nevertheless, we know from a separate source that Scottsdale Unified has 4,000 students from outside of district boundaries, which is more than twice the number of any of the Indiana districts in the Ed Choice map.
So here is my provisional take, subject to your challenge in the comments: Indiana’s combined choice programs have coaxed the state out of the Ohio-like geographic segregation. Private choice program design may have contributed to this- Ohio’s voucher programs focus almost exclusively on urban students, while Indiana’s are more inclusive. Indiana has had the nation’s fastest growing voucher program in recent years. Although means-tested, Indiana’s private choice programs create empty seats in suburban districts more than is the case in the Ohio programs, which reach only suburban special education students.

The open enrollment boulder has been rolling down hill for a longer period of time in Arizona. Open-enrollment students outnumber charter students 2-1, and charter students outnumber private choice participants by 3-1. In other words, in Arizona school choice is being done primarily by school districts themselves. This of course did not happen exclusively through a process of spontaneous enlightenment whereby Arizona school districts threw down the drawbridge over the moat to welcome in thousands of out of district transfers out of the goodness of their hearts. Rather it was the product of incentives- hundreds of charter schools opening in suburbs and towns and a couple of decades of geographically inclusive private choice programs.
Charters and private choice do not deserve all the credit, as some suburban districts relatively unaffected nevertheless chose to participate in open enrollment. Chandler Unified for instance watched their enrollment grow by a third despite a large increase in charter schools and has been rocking academic growth to boot. I’m told that there is not a non-district charter in the Vail Unified district south of Tucson, but there are a many students from Tucson Unified. I doubt they are sweating choice much, but they have nevertheless chosen to participate, and Arizona’s students are the richer for it. Nevertheless, it seems self-evident that a main reason that Scottsdale Unified took in 4,000 students is due to the 9,000 students that live in the district boundaries and do not attend school in the district.

It may be no accident that the state with the highest access has also been leading in NAEP gains…
The defection of early open-enrollment adopters increases the pressure on other districts to participate, creating a virtuous cycle. I’m thrilled to see evidence of this in Indiana. The School Choice 1.0 failed urban students insomuch as it failed to unlock the suburbs. It’s time for the movement to embrace an inclusive “Social Justice Plus” strategy that aims to give urban students access to private, charter and suburban schools.
1 Comment | charter schools, Education Savings Accounts, school choice, vouchers | Permalink
Posted by matthewladner

(Guest Post by Matthew Ladner)
Too much of Arizona’s K-12 debate focuses on inputs, too little on outputs. Some districts have been gaining enrollment, others losing enrollment, but this is an entirely secondary concern when compared to the question of whether an increasing number of Arizona students are acquiring the knowledge, skills and habits for success in life.
The above chart from the Center for Student Achievement shows enrollment trends for districts and charters in a number of Arizona districts. Some districts gained students despite the rise of charters (Chandler, Higley, Queen Creek) while others lost enrollment. All of the above Arizona district/charter combos did well to spectacular in Stanford’s Sean F. Reardon’s measurement of academic growth, with the lone exception of Coolidge Unified.
The Scottsdale district/charter combo came in at the 64th percentile, Tucson at the 67th, Queen Creek at the 68th percentile, Deer Valley at the 83rd, Roosevelt at the 89th. All three of the truly spectacular scores (Higley, Chandler and Phoenix Elementary combos at 95, 95 and 99th percentile respectively) came from situations where both the district and charter sectors grew rapidly. Congratulations to the students and educators of these communities are richly deserved.
The growth party did not stop in 2015. Here are the ELA proficiency trends in AZMerit for all of these districts:
 and here is the same chart for math:

Some of these gains are large (see Queen Creek and Scottsdale) others incremental, but every single one of them is moving in the right direction.

Wait- my telepathic powers are picking something up. You were thinking “Ladner are you really going to celebrate Roosevelt going from 17% proficient to 23%?”
I’m glad you asked.
Two things- first the AZMerit academic bar is high, and second most of the rest of the country seems mired in academic stagnation. Of course I’m not satisfied with 23% proficiency (#NoAZwe’vegottoWinMOAAARRR!) but I am indeed happy that both low performing and high performing districts show improvement.
Experience is a harsh mistress, and one of the things she teaches the policy analyst is to never rely solely on state test scores. NAEP will release 2017 scores in a few weeks. Let’s see what happens next. In the meantime, the freedom for families to choose between schools and the opportunity for Arizona educators to create new schools according to their vision of excellence seems to be broadly working.
3 Comments | charter schools | Tagged: AZMerit, Center for Student Achievement, Chandler Unified, Coolidge Unified, Deer Valley Unified, Higley Unified, Mesa Unified, Phoenix Elementary, Queen Creek Unified, Roosevelt Elementary, Scottsdale Unified, Tucson Unified | Permalink
Posted by matthewladner

(Guest Post by Matthew Ladner)
Just out of curiosity, I decided to look into the Reardon data to see how many Arizona district/charter combos outperformed or tied the Recovery School District in academic growth. The above list is by no means exhaustive, more the product of throwing in some district names into the data base before my morning caffeine. The list is not short, and includes several very poor and isolated school districts.
Mind you that no one bombed any of these districts with millions in philanthropy. You can’t go to a bar in Snowflake Arizona and meet a group of six Teach for America students the way you can in the French Quarter. They also managed this somehow without a “harbor-master.” Finally, the Reardon data ends in 2015, and since then the trend in statewide data in Arizona has been positive, but in the RSD not so much. Hopefully Reardon will update his study so we can track this over time.
I want to be careful to note that I regard the Recovery School District to have been a very clever innovation for a district that had almost nothing to leverage but empty school buildings after a hurricane. If that hurricane however had leveled Houston or Dade County I’m afraid that the limited supply of philanthropic dollars and TFA teachers would have been unequal to the (much larger) task. In order to reach scale, we are going to need solutions that do without substantial infusions of outside money, as that is likely to be in increasing short supply.
Having said that, RSD landing in the 92nd percentile in growth in the Reardon data was truly a magnificent accomplishment. The leap however from “well done” to “everyone needs to do this now!!!!” looks very dangerous imo.
2 Comments | charter schools | Tagged: Portfolio Districts, Recovery School District, Sean F. Reardon | Permalink
Posted by matthewladner
You are currently browsing the archives for the charter schools category.

