
(Guest Post by Matthew Ladner)
Sorry-nodded off before posting the final piece of the ethnic trilogy. On to other subjects…
(Guest Post by Matthew Ladner)
Sorry-nodded off before posting the final piece of the ethnic trilogy. On to other subjects…
 Leave a Comment » |
  NAEP | Tagged: 2017 NAEP |
  Permalink
 Posted by matthewladner

(Guest Post by Matthew Ladner)
A number of state Hispanic sectors closed the gap with the lowest performing statewide Anglo sector (274) in 8th grade math, which is good #MOARRR!
6 Comments | NAEP | Tagged: 2017 NAEP Hispanic Scores | Permalink
Posted by matthewladner

(Guest Post by Matthew Ladner)
The 2017 NAEP will be released next week, and a few notes seem in order. Over time, the term “mis-NAEPery” has slowly morphed into a catchall phrase to mean “I don’t like your conclusions.” Mis-NAEPery however has an actual meaning- or at least it should- which ought to be something along the lines of “confidently attributing NAEP trends to a particular policy.”
Arne Duncan for instance took to the pages of the Washington Post recently in order to lay claim to all positive NAEP trends since 1990 to his own tribe of reformer (center left):
Lately, a lot of people in Washington are saying that education reform hasn’t worked very well. Don’t believe it.
Since 1971, fourth-grade reading and math scores are up 13 points and 25 points, respectively. Eighth-grade reading and math scores are up eight points and 19 points, respectively. Every 10 points equates to about a year of learning, and much of the gains have been driven by students of color.
Duncan then proceeds to dismiss the possibility that student demographics had anything to do with this improvement, as the American student body has grown “It should be noted that the student population is relatively poorer and considerably more diverse than in 1971.” This is a contention however deserving dispute, given that the inflation adjusted (in constant 2011 dollars) income of the poorest fifth of Americans almost doubled between 1964 and 2011 once various transfers (food stamps, EITC etc.) have been taken into account. Any number of other things could also explain the positive trend, both policy and non-policy related, but never mind any of that, Mr. Duncan lays claim to all that is positive.
Duncan was not finished yet, however, as he was at pains to triangulate himself away from those nasty people who support more choice than just charter schools:
Some have taken the original idea of school choice — as laboratories of innovation that would help all schools improve — and used it to defund education, weaken unions and allow public dollars to fund private schools without accountability.
Well that sounds a bit like how a committed leftist would (unfairly) describe my pleasant patch of cactus. Arizona NAEP scores, could you please stand to acknowledge the cheers of the audience:

So the big problem in that chart are the blue columns. These charts stretch from the advent of the Obama years until the (until Tuesday) most recently available data. We won’t be getting new science data this year, so ignore the last two blue columns on the right. What we are looking at is changes in scores of 1 point in 4th grade math, -1 point in 8th grade math, 1 point in 4th grade reading and two points in 8th grade reading. There’s only one state that made statistically significant academic gains on all six NAEP tests during the Obama era, but it just so happens to be one of the ones adopting the policies uncharitably characterized by Duncan’s effort at triangulation.
There were some very large initiatives during these years- Common Core standards, teacher evaluation, etc. and we can’t be sure why the national numbers have been so flat, but let’s just say that a net gain of three scale points across four 500 scale point tests fails to make much of an impression. Supporters of the Common Core project for instance performed a bit of a Jedi mind trick around the 2015 NAEP by noting that scores were also meh in states that chose not to adopt, and that 2015 was early yet. Fair enough on the early bit, but the promise of an enormous investment of political capital in the project was not that adopting states would be equally meh, but rather that things would get better.

Where’s the BETTER?!?
Duncan’s misNAEPery however is of the garden variety- there has been far worse. Massachusetts for instance instituted a multi-faceted suite of policy reforms in 1993, and their NAEP scores increased from a bit better than nearby New Hampshire to two bits better than New Hampshire and tops in the country. So far as I can tell, there was approximately zero effort to establish micro-level evidence on any of the multiple reform efforts, or to disentangle to the extent policies were having a positive impact, which policies were doing what. That would be silly- everyone knows that standards and testing propelled MA to the top NAEP scores, and once everyone else does it we will surge towards education Nirvana Canadian PISA scores. Well, I refer the honourable gentleman to tiny blue columns in the chart I referenced some moments ago.
This is not to say that I am confident that testing and standards had nothing to do with MA’s high NAEP scores. I’m inclined to think they probably did, but some actual evidence would be nice before imposing this strategy on everyone. In Campbell and Stanley terms “Great Caesar’s Ghost! Look at those Massachusetts NAEP scores!” lacks evidence of both internal and external validity. In other words, we don’t know what caused MA NAEP scores, nor do we know who if anyone else might be able to pull it off, assuming policy had something to do with it.
So beware of mis-NAEPery my son- the jaws that bite, the claws that catch! Also beware of NAEP nihilism. Taking off my social science cap, I will note that NAEP is an enormous and highly respected project and it is done expressly for the purpose of making comparisons. Yes we should exercise a high level of caution in so doing, and should check any preliminary conclusions reached against other sources of available evidence. The world is a complicated place with an almost infinite number of factors pushing achievement up or down at any point. There is a great deal of noise, and finding the signal is difficult. NAEP alone cannot establish a signal.
The fact that the premature conclusions drawn from the Massachusetts experience lacked evidence of internal and external validity did not mean that those conclusions were wrong but it did make them dangerous. Alas the world does not operate in a random assignment study. Policymakers must make decisions based upon the evidence at hand, NAEP and (hopefully) better than NAEP. The figure at the top of this post makes use of NAEP and there is a whole lot of top map green (early goodness) turning into bottom map purple (later badness) going on. This is a bad look assuming part of what you want out of your support of K-12 education is kids learning about math and reading in elementary and middle school. Let’s be careful, but let’s also see what happens next.
Leave a Comment » | NAEP | Tagged: 2017 NAEP, Arne Duncan, Sean F. Reardon | Permalink
Posted by matthewladner

(Guest Post by Matthew Ladner)
Unfortunately a large majority of the nation’s K-12 students are in the tight cluster of meh and sub-meh in the stagnation cluster. Judged by 8th grade math and reading gains 2003 to 2015, Arizona, Hawaii and Tennessee are having the best improvement. New York is still alright if you like saxaphones academic stagnation.
The 2017 NAEP will be released on April 10. Anyone else believe in any of these blue dots enough to dare a prediction?

1 Comment | NAEP | Tagged: Lisa Graham Keegan, Matthew Ladner, Mike Petrilli, NAEP, NCLB | Permalink
Posted by matthewladner

(Guest Post by Matthew Ladner)
Ok so there is this thing inside Microsoft Excel called a “macro” and today I had Dr. Youtube teach me how to do it so I can make data labels without manually typing them in. Next step- learn how to set a VCR DVR to record!
2 Comments | NAEP | Tagged: NAEP cohort gains | Permalink
Posted by matthewladner
(Guest Post by Matthew Ladner)
Looking through the Arizona Auditor General report on Arizona school districts, I noticed interesting variation in enrollment trends. Arizona has been the second fastest growing state for decades, and Maricopa County has become the fastest growing county in the nation. Nevertheless, many school districts show steady enrollment trends, and some even declining enrollment. Of course there are others where enrollment is growing like mad, like Chandler (a Phoenix area suburb):

A relatively small percentage of districts are taking the lead on absorbing enrollment growth statewide, along with the charter sector. The enrollment surge in Chandler seems to be working out academically: more kids and more kids performing at a high level:

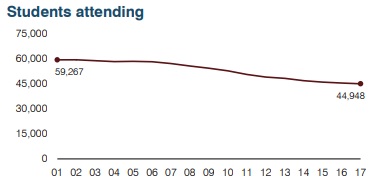
Other suburban districts have not fared as well in the competition for enrollment such as Scottsdale Unified:

This decrease in enrollment is despite of 4,000 open enrollment kids who have transferred into Scottsdale Unified. According to a district demographic study 9,000 families have paid the real estate premium to live in Scottsdale Unified boundaries but choose to send their children to school elsewhere (mostly charter schools). Scottsdale Unified has had a string of recent scandals, with the Superintendent placed on administrative leave, but we should not let this distract us from improving academic trends in Scottsdale Unified:

We can see similar trends in southern Arizona. Tucson Unified also has a declining enrollment trend:
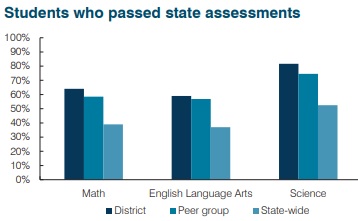
The academic results in Tucson Unified could look better compared to peer districts (middle columns) or statewide averages (right columns):
Vail Unified is one of the Tucson area surrounding districts taking in a number of open enrollment students. Accommodating growth rather than coping with enrollment decline has been the issue in Vail:

Vail getting additional students seems to be working out academically for many students as well, with proficiency rates substantially higher than in TUSD:
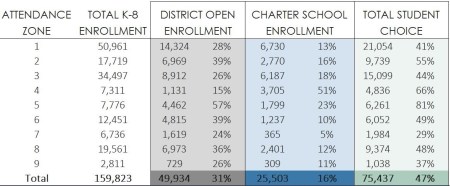
Recently we learned that open-enrollment students outnumber charter students approximately 2-1 in Maricopa County. Choice in Arizona is not being done to districts, but rather by districts. Note as well that rather than a zero sum game, there are positive academic trends in Arizona districts including both districts with declining and increasing enrollment. In this competition, the kids are the winners!

6 Comments | NAEP | Tagged: Arizona Auditor General | Permalink
Posted by matthewladner

(Guest Post by Matthew Ladner)
Large urban districts in Arizona are surrounded by suburban districts accepting transfers through open enrollment. I fear that Arizona is an outlier in this regard, and that the rest of the country is more like Ohio than Arizona. Fordham produced this deeply revealing open enrollment map of Ohio, showing every major urban center to be surrounded by districts who do not participate in open enrollment. Non-participating districts shaded in dark blue:

Now you will recall a similar map of Arizona, with districts not participating in open enrollment again marked in deep blue:

I believe that open enrollment is a big reason that Arizona has been leading the nation in NAEP gains, and that charter and private choice programs deserve some credit the eagerness with which districts participate. Take a look at Columbus on the above map- a large urban district literally surrounded by districts choosing not to allow open enrollment transfers. Now take a look at the school district map of Pima County. The Tucson Unified School District is surrounded by districts that do participate in open-enrollment- actively.
Tucson is a part of the nation’s second fastest growing state, but Tucson Unified has experienced a steady decline in enrollment. This is in part due to the rise of charter schools- as documented by the Center for Student Achievement:
Several of the districts in the chart above gained enrollment despite the increase in charter school enrollment-Queen Creek, Higley, Chandler and Phoenix Elementary. Notice also that these districts, which run a gamut between suburban and urban Arizona, all have growing charter school sectors.
Urban students in Arizona have the opportunity to attend suburban district schools, while their peers in Ohio (and much of the rest of the country) do not. We sadly do not as yet have district by district data on open-enrollment, but research by a Yale student put the figure at almost a third of district K-8 enrollment in Phoenix area districts had utilized open enrollment. We know for instance that Scottsdale Unified has 4,000 students attending through open enrollment. Anecdotally we know that several of the Tucson area school districts are also very active in open enrollment.
Arizona’s urban students have the opportunity to attend suburban schools, and Ohio’s urban students do not. This is primarily in my view because Arizona charter schools have helped open suburban seats, while Ohio’s choice programs have been overwhelmingly focused on urban students. So let’s check NAEP trends for large city students for all six exams for the entire period with state level data:

I’m confident I know what is going right for Arizona’s students in large cities: opportunity. They have the opportunity to attend their home district, suburban districts, charter schools (lots of them) and private schools. Tucson did not participate in TUDA, but does show positive trends in the state’s AZMerit data. Tucson’s enrollment is declining, but scores are improving and that is without factoring in the scores of kids attending suburban district schools, charter schools or private schools with scholarship assistance.
I’m not nearly as confident that I understand what is going wrong for urban students in Ohio, but this:
…is not working for them at all.
Leave a Comment » | NAEP, Open Enrollment | Tagged: Arizona Open Enrollment, Fordham Institute, Ohio open enrollment, Open Enrollment | Permalink
Posted by matthewladner

(Guest Post by Matthew Ladner)
The 2017 NAEP is due to be released in a few weeks, so I thought it would be a good time to review a brief history of where we’ve been. The above table lists all of the available Math cohort gains by jurisdiction for the entire period all states have been giving NAEP. These cohort gains are calculated by subtracting the 4th grade scores of a cohort of students from their 8th grade scores. NAEP math and reading tests were specifically scaled and timed in such a way to allow for such comparisons.
Now…just a minute…stop staring at your state’s results and pay attention…oh okay fine go stare at your state’s results and then come back.
Right, now that you are done with that, allow me to draw your attention to the AVERAGE row at the bottom. This is a simple average between states, and it appears to be in slow but steady decline. Notice for instance Maryland’s transformation from a reform super-hero to a state that appeared to forget to teach mathematics to kids in 6th grade. Notice that the top gains from the 2009-2013 and 2011-2015 periods (Arizona) would have not been the top gainers in the golden age of 2003-2007. Arizona winds up coming top in recent years because they remained consistently pretty high while other states declined.
It should be noted that factors other than the quality of instruction could be at play here. For instance, inclusion rates for students with disabilities and ELL learners may have varied over time, creating the appearance of a decline. To test this, the below table runs the same math cohort gains but this time only for general education students:

Overall the story does not change a great deal- we still see a declining trend, and Maryland forgot to teach math to both general ed students about as much as everyone else. I will also note that Arizona owes its status as the math gains champ for 2009-13 and 2011-15 to gains among special education and/or ELL students, which as someone who worked on choice programs for special needs students in Arizona for a decade and a half, warms my heart:

My guess is that reformers picked the low-hanging fruit of education reform in the early aughts. The introduction of standards and testing in the early days seems to have produced a bump in achievement. Over time however this effect may be fading. Political Science 101 teaches that organized interests defeat diffuse interests 99 times out of a hundred, so the ability of states to employ a cat o’ nine tails and whip schools into improvement has limits. Dozens of decisions taken daily in the musty basements of State Departments of Education and obscure measures voted on by State Boards of Education can slowly but surely defang and/or subvert state accountability systems.
If there are two things that the organized employee interests of adults working in schools are expert at it is passive resistance and bureaucratic infighting. In my book, much of the reform crowd chose to fight their opponents on ground they did not choose wisely, and upon which they have little chance to prevail. Things fall apart, the center cannot hold.
Mike Petrilli recently and correctly imo noted that the 2017 NAEP would be a pretty definitive test on the efficacy of the Obama year projects- promoting Common Core and teacher evaluation, student discipline reform. Top down directives have a funny way of not working out, even backfiring. Let’s see what happens next.
3 Comments | NAEP | Permalink
Posted by matthewladner
(Guest Post by Matthew Ladner)
While some of us continue to CeleNAEP good times, Arizona’s spending lobby continues to inexplicably lament because Arizona spent more money during the housing bubble. One might, as Cartman, even refer to it as unfathomable sadness. Dana Naimark of the Children’s Action Alliance provides an illustrative example of the genre:
Ducey likes to brag about moving government at the speed of business. He says economic growth will take care of our public schools.
But for three years, he has put his foot on the brake for public school funding while directing more of our state’s precious resources to cut taxes for corporations, grow tax credits with no accountability, and support private and religious schools with tax credits and vouchers.
The vast majority of parents who choose public schools have already waited a decade for funding to be restored. Arizona can’t afford to wait another five years without a clear financial plan. We expect reinvestments we can count on, with funding that is permanent and equitable and not built on gimmicks.
Governor, it’s time to answer that call.
I could provide links showing AZ spending per pupil spending increasing over the last three years (could someone please put their foot on my personal finances like this?) but that is just too easy. The genre features either an explicit or implicit assumption that spending is tightly tied to academic outcomes. The folly of this assumption is easily demonstrated. The National Center for Education Statistics for instance pegged current (not total) spending per pupil in Arizona at $7,562 in 2013-14 and New York at $20,440. Delightfully however Arizona students closed the academic gap with New York students.

Just in case you suspect some sort of Math fluke:

If you are a New Yorker, your sadness is entirely fathomable. Data like those in the above charts ought to have people rioting in the streets of Albany demanding to know just what is being done with their tax dollars?

If you live in Arizona, sadness looks unfathomable indeed. If you can’t be happy leading the nation in academic gains then you either have very odd K-12 priorities or else just lack the necessary talent for living happily ever after. Neither problem here!
3 Comments | NAEP | Tagged: Arizona NAEP trends, Dana Naimark, Doug Ducey, New York NAEP trends | Permalink
Posted by matthewladner

(Guest Post by Matthew Ladner)
So…let’s start with the good news: despite dire predictions of apocalypse, human civilization is still alive and kicking. No global trade wars broke out, the economy shows signs of life. If you google around a bit you can learn things like that the Trump administration is running at about half of the pace for deportations from the Obama administration peak.

That’s all I have to say about that. Ok I take it back-you should also read this. Keep your fingers crossed.
The early days of 2017 looked like the year might be a complete K-12 dumpster fire as (too) much of ed reform world went into a Patty Hearst level of Stockholm Syndrome. The response to the K-12 version of the polarization trap went in the direction of “Gaghghghghgh!!!! The sky is falling!!!!! Quick make something up about Detroit charter schools!”

It should be obvious now that this was overwrought. As it happens 2017 goes into the books as a mixed year on the choice front, contra the fears of DeVosaphobes. Advances in Illinois, North Carolina and Wisconsin were offset by a setback in Nevada and a cliffhanger in Arizona. The initial drama surrounding the prospect for federal legislation eventually simmered towards an incremental approach sans apocalypse. Kentucky passed a charter school law, but not one likely to produce many charter schools. There are people getting excited for and against the 529 provision, but color me mostly meh. Other provisions of the tax bill may wind up being more significant.
There was a lot of discussion of ESSA plans. I’m not sure why. Perhaps 2018 will see more of the ESSA cottage industry think through the implications of NGO school rating systems. What’s that? Okay I’ll mark my calendar for 2084. Later?!? Fine. Meanwhile approximately 3,650,000 additional Baby Boomers reached the age of 65 in 2017. No one on either side of the aisle in DC seemed to notice. Arguments over inaugural crowd sizes and Russian conspiracy theories took precedence. Excuse me 2018? I’ll have another 3.65m please! Oh and send the check over to the kiddie table.

Perhaps the most encouraging news I heard this year came from the Modern States Project. MSP developed MOOCs and free online textbooks designed to allow students to pass AP/CLEP courses for only the cost of the exam (~$85.) This looks like a straightforward solution to the credit problem, at least in lower level courses and inches the ball closer to free.
The 2017 NAEP will be released in a few months. Election years don’t usually serve as the setting for broad K-12 reforms, but my money is on Greg beating Mathews yet again.
Let’s see what happens next.
8 Comments | Age Demographic Change, charter schools, NAEP | Permalink
Posted by matthewladner
You are currently browsing the archives for the NAEP category.

