The Rising Tide in the Desert

February 21, 2018

(Guest Post by Matthew Ladner)


Too much of Arizona’s K-12 debate focuses on inputs, too little on outputs. Some districts have been gaining enrollment, others losing enrollment, but this is an entirely secondary concern when compared to the question of whether an increasing number of Arizona students are acquiring the knowledge, skills and habits for success in life.

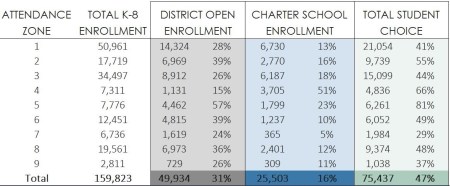
The above chart from the Center for Student Achievement shows enrollment trends for districts and charters in a number of Arizona districts. Some districts gained students despite the rise of charters (Chandler, Higley, Queen Creek) while others lost enrollment. All of the above Arizona district/charter combos did well to spectacular in Stanford’s Sean F. Reardon’s measurement of academic growth, with the lone exception of Coolidge Unified.

The Scottsdale district/charter combo came in at the 64th percentile, Tucson at the 67th, Queen Creek at the 68th percentile, Deer Valley at the 83rd, Roosevelt at the 89th. All three of the truly spectacular scores (Higley, Chandler and Phoenix Elementary combos at 95, 95 and 99th percentile respectively) came from situations where both the district and charter sectors grew rapidly. Congratulations to the students and educators of these communities are richly deserved.

The growth party did not stop in 2015.  Here are the ELA proficiency trends in AZMerit for all of these districts:

and here is the same chart for math:

Some of these gains are large (see Queen Creek and Scottsdale) others incremental, but every single one of them is moving in the right direction.

Wait- my telepathic powers are picking something up. You were thinking “Ladner are you really going to celebrate Roosevelt going from 17% proficient to 23%?

I’m glad you asked.

Two things- first the AZMerit academic bar is high, and second most of the rest of the country seems mired in academic stagnation. Of course I’m not satisfied with 23% proficiency (#NoAZwe’vegottoWinMOAAARRR!) but I am indeed happy that both low performing and high performing districts show improvement.

Experience is a harsh mistress, and one of the things she teaches the policy analyst is to never rely solely on state test scores. NAEP will release 2017 scores in a few weeks. Let’s see what happens next. In the meantime, the freedom for families to choose between schools and the opportunity for Arizona educators to create new schools according to their vision of excellence seems to be broadly working.


District/Charter Combos that Outperform RSD

February 19, 2018

(Guest Post by Matthew Ladner)

Just out of curiosity, I decided to look into the Reardon data to see how many Arizona district/charter combos outperformed or tied the Recovery School District in academic growth. The above list is by no means exhaustive, more the product of throwing in some district names into the data base before my morning caffeine. The list is not short, and includes several very poor and isolated school districts.

Mind you that no one bombed any of these districts with millions in philanthropy. You can’t go to a bar in Snowflake Arizona and meet a group of six Teach for America students the way you can in the French Quarter. They also managed this somehow without a “harbor-master.” Finally, the Reardon data ends in 2015, and since then the trend in statewide data in Arizona has been positive, but in the RSD not so much. Hopefully Reardon will update his study so we can track this over time.

I want to be careful to note that I regard the Recovery School District to have been a very clever innovation for a district that had almost nothing to leverage but empty school buildings after a hurricane. If that hurricane however had leveled Houston or Dade County I’m afraid that the limited supply of philanthropic dollars and TFA teachers would have been unequal to the (much larger) task. In order to reach scale, we are going to need solutions that do without substantial infusions of outside money, as that is likely to be in increasing short supply.

Having said that, RSD landing in the 92nd percentile in growth in the Reardon data was truly a magnificent accomplishment. The leap however from “well done” to “everyone needs to do this now!!!!” looks very dangerous imo.


Tuscon versus Columbus: Round Two

February 16, 2018

(Guest Post by Matthew Ladner)

Yesterday I presented statewide NAEP information contrasting urban schooling achievement trends in Arizona and Ohio, and specifically in Tucson and Columbus. Columbus is surrounded by suburban districts choosing not to participate in open enrollment (typical I fear) while Tucson is surrounded by suburban districts who do participate in open enrollment-and actively so.

Today I remembered the cool data tool that the NYT developed using Sean F. Reardon’s data.

Let me start by saying that if I had to pick a district to showcase Arizona, it would not be Tucson. While I am fully aware of some outstanding schools in TUSD, the district’s reputation (fairly or not-I am no authority on the subject) usually involves enrollment decline, empty school buildings, union sway in school board elections and controversy over some sort of voluntary “La Raza” curriculum in the high schools. A decade ago you could peer into the state’s AIMS data and watch student cohorts fall further behind as they “progressed” through the system.

Arizona however has been leading the nation in academic gains, and Tucson continues to face steady and considerable competition for students not only from charter schools and private choice programs, but also from nearby suburban districts. It is my contention that this broad competition enables the bottom up accountability that results in Arizona’s average charter school closing after only 4 years despite receiving 15 year charters from the state. Reardon’s data includes both district and charter school trends, but how did Tucson fare between 2010 (3rd grade scores) and 2015 (8th grade scores) in terms of academic growth?

Tucson Unified (and charters operating within district boundaries) scored at the 64th percentile for growth during this period. Columbus Ohio meanwhile also had a charter school law active, but no suburban districts willing to allow transfers, per the Fordham map:

How did Columbus fare in the Reardon data?

Columbus scored in the 22nd percentile in academic growth during this period. The news is also grim in Cleveland, Toledo and Dayton although Cincinnati stands out as the Ohio urban progress champion during this period. Overall however things look like in NAEP for the two states.

Now if you want to see something really cool:

The east-west on these columns indicate the relative wealth of the district, and Phoenix Elementary and charters sit at the tip of the gains spear.


Tucson Arizona versus Columbus Ohio

February 15, 2018

(Guest Post by Matthew Ladner)

Large urban districts in Arizona are surrounded by suburban districts accepting transfers through open enrollment. I fear that Arizona is an outlier in this regard, and that the rest of the country is more like Ohio than Arizona. Fordham produced this deeply revealing open enrollment map of Ohio, showing every major urban center to be surrounded by districts who do not participate in open enrollment. Non-participating districts shaded in dark blue:

Now you will recall a similar map of Arizona, with districts not participating in open enrollment again marked in deep blue:

arizona-state-usa-solid-black-outline-map-of-vector-24335079

I believe that open enrollment is a big reason that Arizona has been leading the nation in NAEP gains, and that charter and private choice programs deserve some credit the eagerness with which districts participate. Take a look at Columbus on the above map- a large urban district literally surrounded by districts choosing not to allow open enrollment transfers. Now take a look at the school district map of Pima County. The Tucson Unified School District is surrounded by districts that do participate in open-enrollment- actively.

Tucson is a part of the nation’s second fastest growing state, but Tucson Unified has experienced a steady decline in enrollment. This is in part due to the rise of charter schools- as documented by the Center for Student Achievement:

Open enrollment

Several of the districts in the chart above gained enrollment despite the increase in charter school enrollment-Queen Creek, Higley, Chandler and Phoenix Elementary. Notice also that these districts, which run a gamut between suburban and urban Arizona, all have growing charter school sectors.

Urban students in Arizona have the opportunity to attend suburban district schools, while their peers in Ohio (and much of the rest of the country) do not. We sadly do not as yet have district by district data on open-enrollment, but research by a Yale student put the figure at almost a third of district K-8 enrollment in Phoenix area districts had utilized open enrollment. We know for instance that Scottsdale Unified has 4,000 students attending through open enrollment. Anecdotally we know that several of the Tucson area school districts are also very active in open enrollment.

Arizona’s urban students have the opportunity to attend suburban schools, and Ohio’s urban students do not. This is primarily in my view because Arizona charter schools have helped open suburban seats, while Ohio’s choice programs have been overwhelmingly focused on urban students. So let’s check NAEP trends for large city students for all six exams for the entire period with state level data:

I’m confident I know what is going right for Arizona’s students in large cities: opportunity. They have the opportunity to attend their home district, suburban districts, charter schools (lots of them) and private schools. Tucson did not participate in TUDA, but does show positive trends in the state’s AZMerit data. Tucson’s enrollment is declining, but scores are improving and that is without factoring in the scores of kids attending suburban district schools, charter schools or private schools with scholarship assistance.

I’m not nearly as confident that I understand what is going wrong for urban students in Ohio, but this:

…is not working for them at all.


Eden and Burke on DCPS Fraud

February 13, 2018

Behold my BROOM ye mighty and DESPAIR!

(Guest Post by Matthew Ladner)

Jayblog readers of a certain tenure may recall the case being made here that outside of the DC Opportunity Scholarship Program and DC charter schools, there was little to celebrate for disadvantaged kids attending DCPS. Over the last decade of available NAEP data, it seemed clear that advantaged students were primarily driving the overall improvement in scores, with DC charters at least showing much larger rates of improvement for disadvantaged students compared to the national average. DCPS, not so much:

Well it turns out that my view of DCPS as being largely inept outside of educating advantaged kids in carefully guarded pockets of excellence was excessively benign: DCPS also developed a systemic approach to academic fraud.

Prosecutors Eden and Burke hit the pages of National Review yesterday to bring us up to speed on the various forms of metric-driven academic fraud recently uncovered in DCPS. DCPS has been engaging in systemic fraud in order to “improve” graduation rates. DCPS “improved” graduation rates by giving diplomas to huge numbers of ineligible students, and “improved” suspension rates by taking them off the books. The FBI is on the case. It’s not pretty. Money quote from Eden and Burke:

When former D.C. Public Schools chancellor Michelle Rhee assumed leadership, she had a searing critique, and a clear argument: Urban schools were paralyzed by collective-bargaining agreements and inertia, so the best path forward was to have expert-designed systems for a new generation of leaders to implement. The unions, in turn, warned that administrators would weaponize these new systems to force teachers to go along with dishonest schemes that would harm true education reform in the service of posting meaningless numerical improvements.

It turns out both sides had a point.

Meet the new boss, same as the old boss.


Brookings Hamilton Project to the Rescue on Charter Rankings

February 12, 2018

(Guest Post by Matthew Ladner)

Over the weekend I thought to myself- what if we just used the Hamilton Project’s Access map to rank state charter laws? The Hamilton map measures the percentage of students who have access to a charter school within their zip code. It’s not a perfect measure- some students after all have access to multiple charter schools within their zip codes and others nearby. The measure could be improved upon in theory, but let’s just run with it for a moment. What would a top 10 list look like?

  1. District of Columbia
  2. Arizona
  3. Utah
  4. Alaska
  5. Colorado
  6. New Mexico
  7. Florida
  8. Idaho
  9. Delaware
  10. Michigan

So a quick check finds only Alaska as a state with too few charter students to have made the NAEP sample in 2015. Alaska may be a bit of an anomaly due to the fact that half of the state’s population lives in a single city, meaning that a relatively small number of charter schools in a relatively small number of zip codes could cover a large percentage of the population in the Hamilton project.

So the Hamilton rankings have one state that has yet to produce enough charter students to make the NAEP sample in the top 10, while the National Alliance for Public Charter Schools ranking has six (Indiana, Alabama, Mississippi, Kentucky, Maine and Washington). There is some overlap between the lists (CO, DC and FL) but generally speaking the Hamilton list looks like flourishing charter sectors, while the NAPCS list is full of charter-light charter sectors.

Sector performance is an obsession of wonks, but is of limited significance to parents, who have every incentive to concern themselves more with the fit of individual schools for their child. Nevertheless, if we indulge the wonkiness for a moment, the Hamilton list looks pretty good on NAEP math- most having either high scores or high growth or both. Even number 10 ranked Michigan has this to hang their hat on:

I’ll take the actual Michigan charters over the largely unicorn charter schools of Alabama, Kentucky, Mississippi and Washington any day of the week and twice on Sunday.


Ziebarth Defends the Pageant

February 9, 2018

Miss Indiana crowned as Miss America

(Guest Post by Matthew Ladner)

Todd Ziebarth from the National Alliance for Public Charter Schools has responded to criticism from yours truly, Max Eden and others regarding the soundness of judging charter school laws based on adherence to a model bill, rather than by their results. I encourage you to read Todd’s response.

Ziebarth in essence claims that facts on the ground in the last five laws passed rather than flaws in the laws themselves have dampened the impact of otherwise good laws. I have no reason to doubt that differences in circumstances from state to state will influence speed out of the gate. I however do not share Ziebarth’s preference for ranking charter laws by their adherence to a model bill when it is possible to judge them by their results, like the Brookings Institute did in this map:

This map measures the percentage of students by state who have access to a charter school in their zip code. It’s not a perfect measure- after all some zip codes have multiple charter schools. Perhaps the measure could be improved upon. When however you see states with near zero percentages on this map near the top of a ranking list, something seems out of sorts with the rankings. Yes circumstances can influence how well you come out of the gate, five new laws in a row failing to produce many schools isn’t a fluke, it looks more like a pattern.

Ziebarth notes that if we don’t include the recent charter bills that have yet to produce many charters, then you get a list like (each state listed along with the % of charter students). This revised list however remains problematic.

1 Indiana 4%
2 Colorado 13%
3 Minnesota 6%
4 District of Columbia 46%
5 Florida 10%
6 Nevada 8%
7 Louisiana 11%
8 Massachusetts 4%
9 New York 5%
10 Arizona 17%

Ok, so the top rated law (Indiana) only produced charter schools within the zip codes of 19.5% of Indiana students, and enrolls 4% of the student population. The law has been in operation for a long time, but you as yet cannot even get a NAEP score for their schools because of the wee-tiny size of the population. If one is a utilitarian sort, any set of criteria that ranks Indiana as having the top charter school law seems in need of revision.

Minnesota has the oldest of all charter school laws, but only six percent of the kids, and 37.7% of kids having access to a charter in their zip code for a law that passed in 1991. There is a word for that: contained. Minnesota gets a ton of credit for inventing charter schools, but their law doesn’t seem to be doing a whole lot to provide families with opportunities, or producing competitive pressure to shake things up.

DC meanwhile has 46% of total kids and 87% of kids have access to a charter school in their zip code. It’s also easy to find evidence of academic success for DC charters. Judging by results, this certainly looks like a much better charter law than Indiana or Minnesota. Ironically, the main reason NAPCS dings the DC charter law in their scoring metric is for a lack of equitable funding. DC charters however seem to be funded at a high enough level to capture 46% of the market, to provide access to 87% of kids, and to produce better results than DCPS. They also receive more generous funding per pupil than most (all?) states. There is no contest between DC and either Indiana or Minnesota in terms of outcomes in my book.

Ok I could go on but I think the horse is dead. We’ve reached the point where it is possible to judge charter sectors by outcomes, rather than by a model bill beauty pageant criteria.

In the end charter school laws either produce seats or they don’t. Laws that fail to produce seats are failures. Laws that produce only a few seats are disappointments. Philanthropists should carefully reexamine their grant metrics to guard against the possibility that they have created a powerful incentive for groups to seek the passage of charter laws regardless of whether they ever produce many charter seats. I haven’t seen grant agreements, but I have watched as the last five laws failed to produce many schools. We are supposed to be creating meaningful opportunity for kids rather than merely colored maps.


A Brief History of NAEP Cohort Math Gains-The Low Hanging Fruit Already Picked

February 8, 2018

(Guest Post by Matthew Ladner)

The 2017 NAEP is due to be released in a few weeks, so I thought it would be a good time to review a brief history of where we’ve been. The above table lists all of the available Math cohort gains by jurisdiction for the entire period all states have been giving NAEP. These cohort gains are calculated by subtracting the 4th grade scores of a cohort of students from their 8th grade scores. NAEP math and reading tests were specifically scaled and timed in such a way to allow for such comparisons.

Now…just a minute…stop staring at your state’s results and pay attention…oh okay fine go stare at your state’s results and then come back.

Right, now that you are done with that, allow me to draw your attention to the AVERAGE row at the bottom. This is a simple average between states, and it appears to be in slow but steady decline. Notice for instance Maryland’s transformation from a reform super-hero to a state that appeared to forget to teach mathematics to kids in 6th grade. Notice that the top gains from the 2009-2013 and 2011-2015 periods (Arizona) would have not been the top gainers in the golden age of 2003-2007. Arizona winds up coming top in recent years because they remained consistently pretty high while other states declined.

It should be noted that factors other than the quality of instruction could be at play here. For instance, inclusion rates for students with disabilities and ELL learners may have varied over time, creating the appearance of a decline. To test this, the below table runs the same math cohort gains but this time only for general education students:

Overall the story does not change a great deal- we still see a declining trend, and Maryland forgot to teach math to both general ed students about as much as everyone else. I will also note that Arizona owes its status as the math gains champ for 2009-13 and 2011-15 to gains among special education and/or ELL students, which as someone who worked on choice programs for special needs students in Arizona for a decade and a half, warms my heart:

My guess is that reformers picked the low-hanging fruit of education reform in the early aughts. The introduction of standards and testing in the early days seems to have produced a bump in achievement. Over time however this effect may be fading. Political Science 101 teaches that organized interests defeat diffuse interests 99 times out of a hundred, so the ability of states to employ a cat o’ nine tails and whip schools into improvement has limits. Dozens of decisions taken daily in the musty basements of State Departments of Education and obscure measures voted on by State Boards of Education can slowly but surely defang and/or subvert state accountability systems.

If there are two things that the organized employee interests of adults working in schools are expert at it is passive resistance and bureaucratic infighting. In my book, much of the reform crowd chose to fight their opponents on ground they did not choose wisely, and upon which they have little chance to prevail. Things fall apart, the center cannot hold.

Mike Petrilli recently and correctly imo noted that the 2017 NAEP would be a pretty definitive test on the efficacy of the Obama year projects- promoting Common Core and teacher evaluation, student discipline reform. Top down directives have a funny way of not working out, even backfiring. Let’s see what happens next.


Wild West Podcast

February 7, 2018

(Guest Post by Matthew Ladner)

Yours truly joins Marty West for the Ed Next Podcast on charter schools in the Wild West. My favorite bit is our discussion of Marty’s study using 2012 data showing meh results for Arizona charters. I’m confident that this result was accurate. In fact the 2013 NAEP also showed lower 8th grade scores in both Math and Reading for AZ charters than AZ districts. What gives?

In 2012 the Philadelphia Eagles went 4-12, but earlier this week they won the Superbowl. This doesn’t shock us much in sports as we understand that player turnover in sport is high and one year’s team can be very different from the previous year’s squad. Likewise in a charter sector as dynamic as Arizona’s you literally have had hundreds of charters open and close since 2012. Also during this period you had a large number of young schools mature (the survivors the crucible of their formative stage). The Great Recession was a period of rapid charter school growth in Arizona as many high quality CMOs seized the opportunity to obtain bargain priced properties. That also however meant lots of young schools going through their shakedown cruise periods.

If the Eagles had been playing a large number of rookies in 2012, their record would look bad, but come back a few years later and those former rookies have grown into grizzled vets. The guys who couldn’t cut it are off the squad. So too in 2015 Arizona charter students crushed the ball on all six NAEP exams, and their AZMerit scores have improved subsequently improved in both 2016 and 2017 along with the scores of districts.


I wish I had seen the above Brookings map before writing the Ed Next piece, as it kind of sums up the four corner charter phenomenon in a nice visual. The higher percentage of kids that have access the charters, the more likely it is that your suburban districts will participate in open enrollment. We you have access to suburban (and/or private schools) your willingness as a parent to put up with a dysfunctional charter school moves closer to zero and they get very quick on the draw. Result: Yippie kai yay!


It’s Time for Technocratic Beauty Pageant Charter Rankings to End

February 2, 2018

(Guest Post by Matthew Ladner)

The National Alliance for Public Charter Schools released their new rankings of charter school laws. I gave NACSA grief for their rankings, so I need to be an equal opportunity offender in the interests of consistency I need to do the same for NAPCS. Both sets of rankings rate state charter laws against a model bill, and as a consequence, both wind up ranking relatively weak charter laws in their top 10. There is an obvious problem here- we may not know what a good charter law is, and this may be especially the case given the diversity of needs and cultures across states. Best then to judge charter laws by their outcomes, and here is where you find difficult to justify patterns in the model bill rankings.

Both NACSA and NAPCS have ranked Indiana as the top ranked charter law. There’s a problem with this however as Indiana’s charter school law has not produced many “charter schools.” The Brookings Hamilton project provided this handy map that shows the percentage of students per state that have a charter school operating in their zip code:

A reasonable way to judge the quality of a charter law in my book would be some combination of the following factors-how many charter school seats has your law produced, what does the average achievement of charter school students look like, and the degree of competitive pressure is being generated on the district system. Indiana appears meh on all three fronts, except with regards to academics where they have been too small to show up in the NAEP samples thus far.

So if a judging against a model bill puts Indiana on top, is it possible that there is something wrong with the model bill itself? Yesterday during a lively conversation on social media Max Eden made the following observations regarding states landing in the top 10 of the NAPCS rankings:

Mississippi is 5 years old. There are two charter schools there.

Maine is 8 years old. There are nine schools there.

Washington state’s law is six years old. They have 8 schools. And what, then, are the rational grounds for believing that these newer laws are superior?

So, three of your top 10 states have produced 20 schools in 20 years. There is no rational case for why this is a better approach. If state policymakers follow your model law, charter growth will be strangled.

You need to be very innocent with lots of solid alibis if Max Eden is prosecuting a case against you, and well, things are looking pretty grim for the model bill approach. Referencing the handy Brookings map above we see only 4.3% of Maine students have a charter school operating in their zip code. Less than one percent in Washington, and then you Mississippi…zero point zero.

This map is from 2015 so things are somewhat better now, but not much and the point remains. Kentucky passed a charter law, and it also landed in the NAPCS top 10. I read a late (not final) version of the bill, and based upon that reading I would say we should expect the sort of pace that Eden noted in Maine, Mississippi and Washington. The draft I read greatly empowered school districts to interfere with the operations of charter schools to an extent that struck me as likely to dissuade rational actors from coming in from out of state, and all but the most gung-ho in-state operators.

If charter school laws that fail to produce charter schools are topping your rankings, it is time to reexamine the bill. There looks to be something or somethings deeply wrong with it. In meantime, congratulations to Indiana for winning what amounts to a technocratic beauty pageant.

OMG! I knew that one year default closure provision would impress the judges!

If you’d like to see the states whose students are actually benefiting from their state’s charter laws, the Brookings map is a good place to start. The first duty of a charter school law is to provide charter school seats- any charter law is somewhere on the boutique curiosity to abject failure spectrum without them. Summing up it is best to always remember:

Godzilla 1998 Fishing
Size does matter…