A conversation with Robert Pondiscio convinced me that it would be a good idea to balance progress with overall scores. Growth is dandy after all, but it is not the end-all-be-all. So here goes with math- statewide scores for 8th graders in 2015 by overall cohort progress between 4th graders in 2011 and 8th graders in 2015. Bonus-more states labeled. It’s a slow process so if I missed a desired state just let me know in the comments.
So the high performing usual suspects do better in this chart clustered over on the right side of the horizon. The 2015 NAEP math swoon hit some states very hard- yes I’m looking at you Florida, Maryland and North Carolina. Between 2013 and 2015 these states experienced a 6 point, 4 point and 5 point drops in 8th math respectively. Florida’s case was very odd as statewide charters and Miami Dade escaped the swoon. We will see what happens when the new data is released for in 2017 in January.
Hey kids guess what the fun just doesn’t stop-now with Greg requested smaller dots! Pictured above are the math and reading NAEP cohort improvement rates for states for Black students. In what can no longer be described as a surprise, Michigan did well. Bad look for Massachusetts and Delaware. Here is the same data in scale points:
Quick post just to note that the outlines of the story remains broadly similar whether you measure cohort NAEP gains as percentage increases or simply as scale points gained: AZ statewide still leads the field, AZ charters still beats the field like what Clubber Lang did to Rocky in their first encounter in the ring, Michigan charters still edge Louisiana charters, Maryland still needs to invest in ammo and a fortified island complex in hopes of surviving the nuclear zombie apocalypse. The main storyline here is that like the Credo report finding Detroit and New Orleans neck and neck, NAEP finds a similar result in 2011 to 2015 cohort gains for Louisiana and Michigan charters.
The question of which measure is better seems debatable imo so it is easier to simply present both.
When Doug Harris took to the pages of the New York Times to denounce Michigan charter schools as “the biggest school reform disaster in the country” he might have profited from an honest reading of the research literature and 10 minutes looking at NAEP data. For example, it took about 10 minutes to calculate the above chart. Michigan charters must be the fastest improving “disaster” yet seen.
Harris went on in the piece not just to trash Michigan, but to boast of the wonders of New Orleans charters. Harris used New Orleans to contrast as the Happy Hunting Grounds of charter schooling in contrast to the Detroit hellscape:
The New Orleans results have been impressive. In the decade after the reforms, the city’s standardized test scores have increased by eight to 15 percentile points and moved the district from the bottom to almost the state average on many measures. High school graduation and college entry rates also seem to have improved significantly, even while suspensions, expulsions and the rate of students switching schools have all dropped. Detroit and New Orleans represent radically different versions of school choice — and the one that seems to work is the one that uses the state oversight that Ms. DeVos opposes.
Well that sounds awfully impressive, but it perhaps less so when you check the only common metric testing data available in both Michigan and Louisiana charters-NAEP. When you plot the cohort gains of Louisiana and Michigan charter schools against state averages, it looks something like:
NAEP cohort gain calculations have their limitations, but the reader should note that similar findings to these were found in research on trends in state test scores. Perhaps someone will be kind enough to provide a link to the Credo dot chart showing nearly indistinguishable growth performance between Detroit and New Orleans in the comment section, but it was reminiscent of this chart as I recall.
Ironically, Harris also denounced Detroit charters as a “Wild West.” Just for the record- here is what a real Wild West charter sector’s results looked like between 2011 and 2015:
Regular Jayblog readers may recall the tizzy that some worked themselves into about Michigan charter schools after Betsy DeVos was nominated to serve as Secretary of Education. Oh they are horrible, terrible, no good, “Wild West” etc. Max Eden and others attempted to set the record straight, noting Credo studies and other evidence showing stronger performance for Michigan charters. Not everyone much cared to consider any of that evidence business, and rumors of horrible Michigan charter school performance linger on to this day.
Well it turns out that NAEP cohort gains reinforce the conclusions of the Credo study and two other studies finding positive charter results. Those look like respectable math gains and very strong reading gains for “the biggest school reform disaster in the country” to these eyes. NAEP cohort gains are not perfect or infallible measures, but they are pointing in the same direction as the studies. Moreover, cohort gains rank above merely looking at raw scores as measures of school quality, which is **ahem** precisely one of the mistakes that critics made.
If Michigan charters are a catastrophic failure, what are we to make of the majority of state education systems (aka the blue dots)? Maryland is getting nervous with all of this disaster talk. If Michigan charters are a reform disaster then the Maryland school system just might qualify as a non-reform post-nuclear zombie apocalypse extinction event.
Maryland need brainnnns…and SPF 50,000 sunscreen!
If Michigan’s charter school skeptics would like to take a crack at explaining the above data from the National Assessment of Educational Progress and the three studies showing positive results the comment section courteously awaits your visit. Otherwise the line to offer an apology to educators running Michigan charters and the students making academic progress in them forms to the left.
Orlando’s victory ought to have come to the surprise of approximately no one. Stock picking chickens began defeating money managers decades ago. Recently the Wall Street Journal ran a long article demonstrating that the mutual funds rated five stars by the Morningstar service rarely hold on to that rating for very long.
So other than the obvious (buy index funds rather than pay for “expert” advice) what does this have to tell us about a panel of experts donning their lab coats in order to predict which schools will either perform well or flounder?
Things get even more complex with regards to schools when compared to stocks. Stocks have a very straightforward metric of value- a price. A well-meaning panel of school experts lacks a comparable metric, with enrollment trend and wait lists being the closest available analogies to prices. Such panels tend to rely on test scores, but past test scores may not only fail to predict future test scores, K-12 test scores often fail to predict future success in life.
Alas Newt the Alien apocalypse survivor died in a really unwatchable sequel, but Orlando the Cat might be available to make life and death decisions for New Orleans charter schools. Apparently, just as with finance, panels of “experts” are not to be trusted with this task. Even if such metrics did predict future test score growth, we ought not to feel overly assured as the relationship between K-12 test scores and future success seems somewhere on the weak to tenuous spectrum in the currently available research literature.
Now if you don’t like the idea of a cat dropping a toy mouse on a numbered grid to decide which charter schools get approved and which close, we might decide to leave this task primarily to the collective judgments of parents. We’ve been earnestly assured that we can’t do such a thing because it didn’t work out in Cleveland or in X, but given the complete inability of humans to forecast the future, expert panels doesn’t have much of a chance to add value anywhere over the long run.
Rather than flattering itself with the notion that their expertise has prepared someone to exercise technocratic authority properly, the reform movement should spend time investigating the conditions under which bottom-up accountability succeeds and the conditions under which top-down accountability fails. Such an investigation could move the discussion beyond stale polemics such as should the government ever close a school and towards an investigation of the sorts of conditions that lead to success. How many options do parents need before they can effectively take the lead in closing schools?
I’m guessing the answer to this last question requires more than “zoned district school and young urban charters.” Turns out that the howling wind of purifying creative destruction story is a bit much when your only options are your zoned district inner city school and a handful of young inner city charter schools. Here in Arizona zoned district school, suburban district schools, tons of other charters and private school choice seems to be putting down new charters in a mere four years despite the fact that they have a 15 year charter from the state. A large majority of closed charters aren’t lasting long enough to reach a renewal process.
The benefits of such a system as opposed to heavy reliance on a panel of experts or even a cat seem both abundant and apparent.
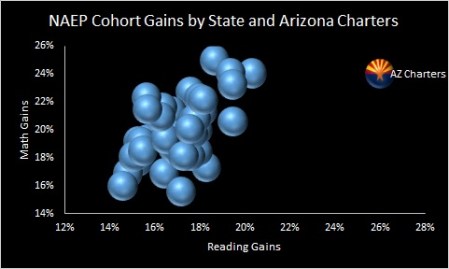
My son Benjamin was looking at the Jayblog, and I asked him “what do you think it would look like if I put Arizona charter students in one of those state NAEP cohort gain dot charts?”
He said “You’re going to need a bigger chart.”
Yup
Feel free to note ways in which it is not fair to compare charter cohort gains to statewide gains (there are indeed some) in the comments section. It is also “not fair” that some of those blue dots spend twice as much per pupil for a student body of relatively wealthy kids but get an oxygen tank shot into their academic toothy maw by a majority-minority student body.
When I think of Maryland, the scene of Liz Taylor riding a horse in the 1956 film classic Giant always comes to mind. Taylor’s character grows up in Maryland but subsequently moves to a desolate western ranch. The film maker used the rolling green hills of Maryland as a way to make a stark visual contrast with the desert southwest.
Likewise here in my arid state my friends on the left yearn to be Maryland. More spending and less choice = more better according to this way of thinking. Well, hmmm….what does the NAEP have to tell us about this POV?
As discussed in the previous post, Maryland had previously not complied with NAEP inclusion standards for students in special programs. They righted the ship in 2015, and it is reasonable to expect that compliance with those standards would have a substantial impact on, for instance, the scores of students with disabilities. Did compliance with inclusion standards also have a large impact on the overall scores for Maryland students? The above chart shows cohort gains from 2011 to 2015 in math and reading. The 2011 scores would have been out of compliance, whereas the 2015 scores were in compliance with NAEP inclusion standards. Did inclusion standards drive these poor results?
The drop in Maryland NAEP scores between 2013 and 2015 looks sudden and sharp. There may be no absolution to be found here for Maryland, as if it is the case that compliance with inclusion standards caused scores to drop precipitously, then the state’s reputation as having a high performing school system may have been built on exclusion of special program students. In other words, even if things are not as bad as they look in the above chart, they may shift to a different type of bad.
To test this question-have Maryland’s inclusion practices inflated their NAEP scores or did they just do poorly in 2015?- I ran cohort gains for general education students. General education students here are neither in ELL or SPED programs, and thus immunized from changes in inclusion standards over time.
For those of you squinting at your iphone, Maryland moves from dead last to merely clumped among the dead-last blob at the bottom left. Thus we conclude that changes in inclusion standards did play a role in the precipitous drop in 2015 NAEP scores, but that the state’s school system has bigger problems with which to wrestle. In other words, there is some real meh, not just the appearance of meh, especially if one were to bring spending into the conversation.
Deprived of the gains of special program students, Arizona slips slightly while Tennessee shows the largest overall gains for general education students. The 2017 NAEP data will be released in January, so let’s see what happens next.
Ok so here is what is going on in this chart: NAEP Math and Reading tests are timed and scaled in such a way as to allow for the calculation of cohort gains. In this case, we’ve tracked the statewide gains for students with disabilities from 4th graders in 2011 to 8th graders in 2015. Both the 2011 and 2015 measurements are a population estimate, and NAEP of course is not tracking the same students over time but rather are sampling both populations. The calculation used here is a straightforward 2015 8th grade scores for students with disabilities minus the 4th grade 2011 scores for students with disabilities, and then calculated as a percentage of improvement between 4th and 8th grade.
Students move in and out of states over time, but this sort of error should be largely random and cancel itself out in the absence of some (relatively implausible) systematic bias (like in this case higher performing students with disabilities fleeing Maryland to live in Hawaii). Given the standard errors, there isn’t much reason to fuss over exactly where you stand if you land say in the middle of the blue blob in the chart above, although one might take an interest in the states landing in the top right or bottom left.
Congrats to Hawaii and Arizona. Bad look for Maryland if taken at face value- having one of the nation’s highest spending per pupil figures but failing to teach students with disabilities much of anything about math and reading over a four years is, ah, terrible. Maryland is a state that had in earlier years flouted the NAEP’s inclusion standards for children with disabilities. It is possible that if they stopped doing so in 2015 that it may explain part of their place on this chart. If I lived in Maryland I would get to the bottom of this, but it’s time to get out of my pajamas.
For Hawaii and Arizona:
We’ll circle back and see how this goes when the new NAEP data is released in January.
Not bad Hoosiers, not bad at all. I mean granted you’ll have to pick your game up to keep pace with Arizona students but look at least you aren’t hopelessly behind the pack like most of that blue blob. New NAEP data released in January- bring it on!


 Posted by matthewladner