
(Guest Post by Matthew Ladner)
The 19th Edition of ALEC’s Report Card on American Education: Ranking State Performance, Progress and Reform coauthored by yours truly and Dave Myslinski hit the presses today. Lots of good stuff in this year’s model, including an update of state rankings, a review of the first decade of universal NAEP participation, and a chapter focused on comparing the results of large urban districts.
So going up to the 30,000 level and back down, international results show that the United States is world-class in spending per pupil, not so much in learning per pupil, and that our results for Black and Hispanic students are closer to those of Mexico than of South Korea, despite the fact that Mexico has a far larger poverty problem and spends a small fraction of American spending.
The United States is making progress, but only an average amount of progress so we aren’t going to be catching up much at the current pace. When you break down American results by state, you find that some states are pushing the national average cart, while others are riding in the cart. Which ones? Glad you asked:
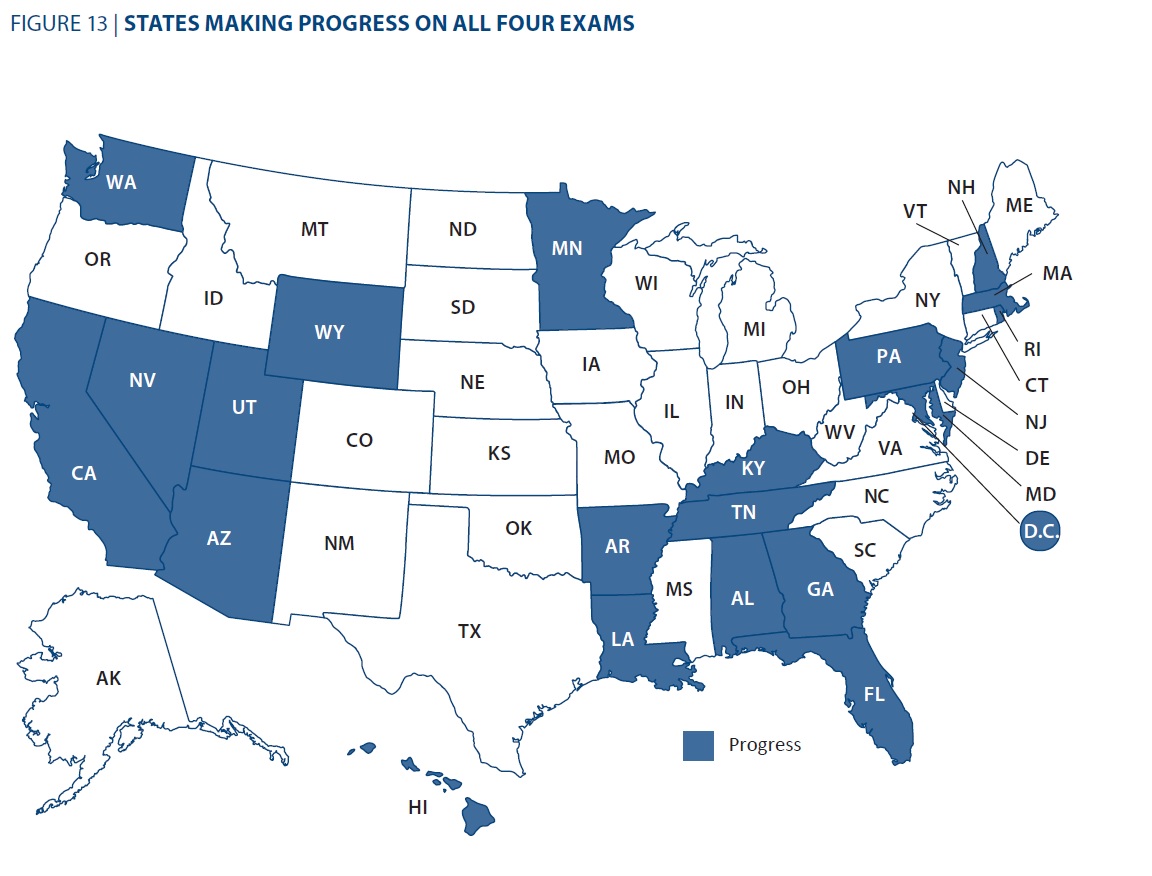
So the states in blue have made statistically significant gains in all four regular NAEP tests (4th and 8th grade reading and math) between 2003 and 2013. Of the 21 states pulling that feat off, 14 are located in either the West or the South. The Midwest excepting MN, Great Plains, Mid-Atlantic, New York and Texas didn’t carry their weight on improvement (to varying degrees in general math gains were easier to come by than reading, 4th grade improvement easier than 8th grade) during this period. Michigan was the only state to make no significant progress on any of the four regular NAEP exams, a trend I hope they will reverse soon. All other states made progress on one or more of the exams. Note also that this map only shows improvement, few if any of the darkened states have internationally competitive scores, and the few that do tend to hold the good end of the stick on various achievement gaps.
So on the one hand, American education outcomes have never been higher than the 2013 NAEP. On the other hand, no one yet has any cause for celebration. When we have any states that approach a Asian/European level of bang for the buck in learning outcomes, we’ll let you know about it, but thus far, not so much.
In Chapter 4 of the Report Card we take a close look at the Trial Urban District Assessment (TUDA) NAEP and apply the same “general education low-income” student comparison that we use in the states to improve comparability. Low-income general ed kids were seven times more likely to reach the Proficient level of 4th grade reading in Miami (the top performing district) as in Detroit (the lowest performing). Mind you have only a little better shot at 1 in 3 of scoring Proficient in Miami, so there are many miles to go. Looking at both 4th and 8th grade reading, Miami, New York City, Hillsborough County FL (Tampa) and Boston cluster near the top of the ratings. The District of Columbia does not (yet) rate near the top of the ratings, but their progress over time on NAEP is nothing short of remarkable since the mid 1990s. A large percentage of District students attend charter schools these days, and those charter schools show not only higher scores but also faster improvement than district schools, which are themselves improving.
In any case, slide on down to the following link if you want to see how your state is doing.


[…] students are now competing internationally for job opportunities; study co-author Dr. Matthew Ladner provides interesting commentary on that […]