My very first academic publication was (I thought) a devastating debunking of election forecasting models. Several leading political scientists and economists had developed regression models that claimed to have perfect records of predicting presidential election outcomes. I showed that these models were only perfect in “predicting” elections that had already occurred. With only a dozen or so observations and five or so independent variables, these models were over-fitted to the data so that they could score a bulls-eye by drawing the circles after the arrows landed.
That was almost a quarter-century ago and despite my warnings election as well as sports forecasting have grown into major industries. Their methods have become more complicated but the fundamental defect of this enterprise remain the same: most forecasters incredibly overstate the precision of their predictions. That is, most election and sports forecasters claim to know things that they simply do not know.
Let’s take the recent presidential election to illustrate the problem. Nate Silver, who has achieved celebrity as a leading forecaster, predicted just prior to the election that Hilary Clinton had a 71.4% chance of winning the presidency. How did Silver arrive at this incredibly precise sounding forecast? Basically, he takes a large set of state and national poll results (including their reported margin of error), weights the polls by his assessment of their past accuracy, and then given that each poll provides a probability distribution of the result he runs simulations that draw outcomes from those probability distributions by chance. In 714 out of 1,000 such simulations Clinton would win the White House.
There are two major flaws in this method. First, the margin of error reported by polls only captures the errors given that the model is correct. We also have uncertainty about the composition of the model and that error is never quantified or reported. To make this less abstract, consider the USC/LA Times poll. Every poll, including USC/LA Times, has to make a series of assumptions and choices to construct its model. Each one of those assumptions and choices is made with a certain amount of uncertainty, which is not contained in the margin of error but can have a strong effect on the prediction.
So, when polls disproportionately get responses from certain segments of the population, they have to make choices about how to weight the responses they have so that they are representative of the full population for whom they are making the forecast. But what method should they use for weighting their respondents? You might not think such a small, technical detail would matter, but as the recent experience of the USC/LA Times poll indicates, the choices you make about weighting would determine the result.
We only know this about the USC/LA Times poll because they happen to make their raw data available in real time so others can re-analyze with different assumptions. The USC/LA Times poll was also exceptional in that it was one of the only polls predicting a Trump victory (although in the end even they were mistaken in that they were predicting the share of the popular vote, which Trump lost). Their openness about the data and their outlier prediction attracted Ernie Tedeschi to re-analyze their data using different assumptions about weighting responses.
As it turns out, the USC/LA Times poll used a non-conventional method of weighting their respondents to be similar to the share of people in the Census within “micro-cells.” They would re-weight their respondents to have the same proportion of small groups as found in the Census, like college-education, African-Americans under 30, rather than large groups, like African-Americans or college-educated people. Tedeschi showed that if you re-weighted the USC/LA Times poll using large groups you would flip the result, so that Clinton had a large lead rather than Trump.
The point here is that whether you weight by small or large groups does not seem to be theoretically important, but it makes an enormous difference in the predicted result. The uncertainty we have about which seemingly arbitrary weighting method to use is not captured at all in the reported margin of error. That margin of error only tells us the uncertainty within the model. But not knowing how to weight respondents represents uncertainty about the model. Silver’s simulation method only incorporates the error within models, not the error about models and therefore grossly overstates the precision of his estimates.
The USC/LA Times poll illustrates the second major flaw, which is that the polls are not independent observations as Silver’s method assumes. That is, errors about model construction are correlated across polls, meaning that if they are wrong about something, they will almost all be wrong together. For example, one of the criticisms leveled against the USC/LA Times poll is that its weighting method was not the “convention” or “best-practice” among pollsters. Another way to put that is that pollsters tend to make common assumptions about the construction of their models. But if any of those seemingly unimportant assumptions turns out to be wrong, not only will the forecasts be off, but the error will be common across polls.
Silver’s simulation method requires that the errors of model construction are random and will balance themselves out across polls so that one will make a wrong assumption in one direction while another makes a wrong assumption in the other direction. But that isn’t right. Pollsters are making their decisions mostly in common according to conventions or best-practices. The USC/LA Times poll stood out because it deviated from that herd mentality among pollsters.
These two errors I’ve described are not small things. As I’ve shown, a single seemingly unimportant decision about how to weight respondents can change who the predicted winner is. And pollsters are making dozens of these decisions, any one of which could alter the predicted outcome, without even knowing that they are doing so. And on top of all of that, the pollsters tend to make common decisions about these matters, so when they are wrong, they and Silver will all be wrong together.
Silver wasn’t just unlucky. The truth is that neither he nor the pollsters on whom he relies could know a priori what the right assumptions were about weighting, turnout, or a host of other matters. If he simply said that he thought it was more likely than not that Clinton would win, he might be able to defend his prediction. But given all of the uncertainty I’ve described taking his prediction to the tenths place just shows him to be a quack.
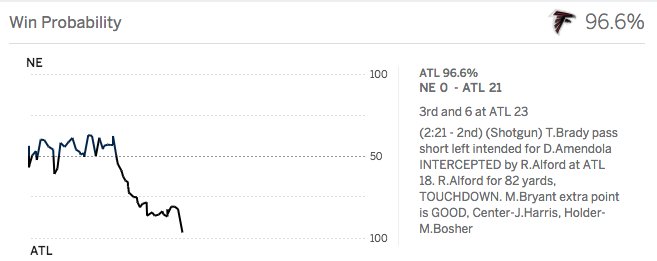
Unfortunately, we just have a hard time dealing with uncertainty. It would be comforting to us if the world were orderly and predictable, so we turn to charlatans like Silver, or the UpShot, or ESPN’s in-game prediction model as people once turned to lucky totems or end-of-days preachers. The hard reality is that there is a lot more uncertainty in the world than these folks would admit and the highly fallible methods of social scientists and charismatic preachers offer little relief from that reality.


I’m especially unimpressed (and was before the surprise election result) with the new “% chance to win” metric. People are getting dangerously naive.
Agree with Greg (gasp!) What are metrics for Common Core to improve public education? What are metrics for charters/vouchers to improve public education?
The most important metric is parent satisfaction, since parents care intensely about their children’s education and have the knowledge and intelligence to judge adequately whether they are getting an education. Other metrics on which school choice has been shown to improve education include standardized tests, graduation rates, college attendance rates, college completion rates, ethnic integration, tolerance for the rights of others and civic participation, as well as others I’m not remembering off the top of my head.
We can always benefit from the development of new metrics, of course!
So, how does Common Core rate, using your suggested metric of “parent satisfaction”?